Saturday, September 14, 2013

What's driving VIX futures spread higher?

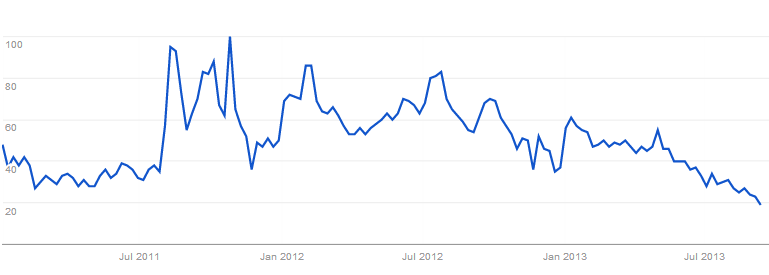
The focus is on the FOMC meeting this coming week. Market participants, economists, the public  - all want to know if the "taper" is coming. The Google Trends search frequency for "Fed taper" has spiked in recent weeks.

Google Trends phrase "Fed taper" (search frequency over time)

The reduction in securities purchases is however already priced into the market, with the expectations varying between $10bn and $15bn per month. The markets are prepared and are now looking beyond the FOMC meeting. And things are not looking too certain in the next couple of months. The spread between the November and the October (post FOMC period) VIX futures has risen, pointing to expectations of higher volatility ahead.


Where will the markets begin to focus after the FOMC meeting? The situation in Syria of course still runs the risk of causing market havoc globally. But judging by Israel's sovereign CDS spread, it seems that the probability of a US-led military conflict has receded. Prospects for a diplomatic solution or a status quo situation have improved.


And while crude oil prices remain elevated, a great deal of that premium is not due to Syria any more. Instead it is the reduced output from Libya that is keeping prices relatively high (see NYT story, which demonstrates that getting rid of a ruthless dictator does not necessarily improve stability or prosperity).

So if the Middle East is not expected to flare up, why has the VIX futures spread increased so much? Clearly there are a number of other macro risks, but markets are beginning to pay attention to the upcoming budget fight in Washington. And this one has the potential of becoming quite ugly.
CBSNews: - If Congress doesn't send Mr. Obama a spending bill by Sept. 30, the federal government would partially shut down. Quickly after that, Congress will have to raise the nation's debt limit or risk letting the government default on its loans. As these deadlines approach, Democrats and Republicans remain deadlocked over federal spending levels -- lawmakers either want to restore the spending slashed as part of sequestration, or replace the sequester with "smarter" spending cuts.
What could make the debate particularly contentious is the fact that President Obama's approval ratings have slumped recently. House Republicans are running less political risk - and in fact could gain more support from constituents - if they dig in for a fight against what they perceive as a weakened administration. Remembering a similar situation in late summer of 2011, the uncertainty around possible outcomes of such a confrontation certainly has the potential to roil US markets.

Source: Gallup


SoberLook.com
From our sponsor:

Canadian household leverage still growing

As discussed a few months back (see post), Canadian households continue amass higher levels of debt. At this point in the cycle, consumer leverage should have stabilized - particularly given tighter lending standards imposed by the government. However household credit outstanding as a fraction of disposable income hit another record last quarter.

Source: Statistics Canada

The good news is that Canadians' net worth has been improving and the debt growth remains slow relative to pre-recession levels. That doesn't mean the situation is without risks. Canada's household leverage is now materially higher than that of other nations who love credit, namely the UK, Spain, and the US. The overall consumer debt levels are also rising as a fraction of the nation's GDP.

Source: Statistics Canada

Somewhat surprisingly, Canadian seniors are now getting quite comfortable with high debt levels as well. It's a dangerous trend.
CBCNews: - The increase in debt among seniors was the biggest year-over-year of all age groups.

Jeffrey Schwartz of Consolidated Credit Counseling Services of Canada says the finding on seniors' debt is in line with other reports that show bankruptcies among retirees is on the rise.

"That's what scary about this," he said. "Seniors are carrying more debt into retirement. They are trying to maintain a lifestyle they had pre-retirement but on post-retirement income, and if income has dropped, they are increasing their debt to cover off their spending. It's a very dangerous strategy."

He added another possible cause is that seniors are supporting their grown children in greater numbers.
Furthermore, Canadian households are becoming increasingly exposed to real estate. This makes Canada vulnerable to an economic downturn, as falling property values could quickly erode wealth and increase delinquencies.

Source: Statistics Canada

This rising debt burden could inhibit the nation's economic growth because the consumer is less likely to contribute to any expansion without further debt increases. The currency markets are not ignoring the situation, with the Canadian dollar moving lower (USD moving higher) on the news on Friday.

USD/CAD (source: Investing.com)

Bloomberg: - “The household debt number shows you can’t expect the Canadian consumer to contribute much to Canadian growth, and reflects the troubles the Canadian economy still faces, which is not a positive for the currency,” said Adrian Miller, director of fixed-income strategies at GMP Securities LLC in New York. “Any strength in the Canadian dollar has to be discounted, as the bias is still to the downside as the U.S dollar gains strength with a better economic performance and expected tapering from the Fed.”


SoberLook.com
From our sponsor:

Friday, September 13, 2013

Is mitigation of rate risk worth buying HY loans at sub-5% yield?

Demand for leveraged (sub-investment grade) corporate loans remains strong. Investors are paying a premium for floating rate (LIBOR+spread) paper that is supposed to protect them from rising interest rates.

Fund flows into loan funds (source: GS)

At the same time CLO issuance is expected to spike. CLO managers have been accumulating (warehousing) a great deal of this collateral in preparation for the tranche sales.


This demand is providing price stability in the syndicated loan market, as these products continue to outperform HY bonds.

(ticker symbols: SNLN and HYG) Source: Ycharts

As a result of this demand, yields on leveraged loans have been compressed and pricing is starting to look frothy. It is important to remember these are (on average) single-B type corporate loans. The yields are now sub-5% - near record lows.


While the US corporate sector is in good shape, are investors being paid enough for the credit risk? Default rates are still quite low relative to historical averages, but have risen lately. The trend shown above and the one below look a bit inconsistent.


SoberLook.com
From our sponsor:

Wednesday, September 11, 2013

Gold demand from Asia offsets ETF selling

Gold ETFs have seen significant outflows since March,  as investors concerned about tighter monetary conditions and rising real rates, have been exiting precious metals. ETFs' gold holdings peaked at the beginning of the year and have been on a decline since. 

Source: JPMorgan

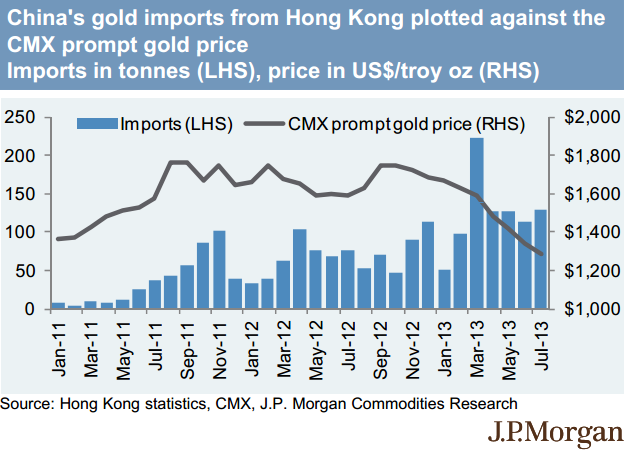
But as prices fell, the declining demand from ETFs and other investment products (such as hedge funds) was to some extent offset by demand from Asia. China has ramped up imports materially this year. Moreover, as the nation's economic growth stastabilizes (see post), the demand should remain robust. 


SMM: - On a net basis, China’s gold imports from Hong Kong totaled 113 tons in July this year, more than double net imports of 46 tons in July last year.

“Physical gold demand in China has clearly picked-up in July after gold prices hit the year-to-date low of $1,181/oz on June 28. This increase in demand helped contributed to bullion’s price recovery to over $1,300/oz at the end of July,” the bank added.

“More recently, bullion’s premium on the Shanghai Gold Exchange, an indicator of demand, has softened to low double digits from the $20-30/oz range seen in July and August, they continued.

“However, the recent pull-back in gold prices sub $1,400/oz level may be an encouraging sign for price sensitive physical buyers to step back into the market. That said, China’s gold imports may remain at elevated levels for the medium term, in our view,” the firm concluded.
India's imports rose 45% in the first half of the year, and in spite of the recently imposed controls, demand by jewelry manufacturers remains strong. Once these controls are lifted, the inventory rebuild will commence. Other nations such as Turkey, Pakistan, Saudi Arabia, UAE,  and even Vietnam are continuing to generate demand. This offsets some of the volatility created by financial sellers and in effect acts as a floor on price. As price declines, physical (as opposed to financial) buyers in Asia enter the market in size. 

From our sponsor:

Refinancing collapse resulting in bank job losses

The Mortgage Bankers Association's refinance index fell by 28% over the past week, as the refi gravy train came to a screeching halt. The Google Trends search frequency for "mortgage refinance" remains a good indicator of refi activity and is now at the lowest level in years.

Google search frequency for "mortgage refinance"

In response banks are loosening lending standards and laying off employees. Volumes are falling sharply.
Charlotte Business Journal: - Wells Fargo's booming home loan business is slamming the brakes this quarter. Chief Financial Officer Tim Sloan says the San Francisco-based bank expects a 30% drop in mortgage volume in the third quarter. Wells estimates originations this period will dip to about $80 billion from $112 billion in the second quarter.
Wells announced that it is cutting 2,300 jobs, Citi 2,200, BofA 2,100, and Chase as many as 19,000 through 2014. There will be more to come.

SoberLook.com
From our sponsor:

Tuesday, September 10, 2013

The US Northeast region struggling with job growth

The US Northeast had weathered the Great Recession a bit better than the rest of the nation. In particular the region's labor market wasn't hit as hard.  The unemployment rate did not rise above 9%,  while the national rate was hovering around 10%. Part of the reason for this difference is that the Northeast's exposure to housing jobs had been lower on a relative basis. 

But as the unemployment rate fell nationally, the improvements in Northeast's labor market did not keep up. The region's unemployment rate is now at or even above the national level. 


More recently another indicator began to show relative weakness in the Northeast's labor market. The JOLT job openings rate published by the Bureau of Labor Statistics has stalled recently at the national level. But in the Northeast,  job openings have actually been declining. 

With sufficient labor mobility the two should converge over time. But underwater mortgages make moving difficult for many. 

For now the labor market indicators show the Northeast lagging the rest of the nation. Going forward it will important to see if this weakness is limited to the region or if it spreads nationally. 


SoberLook.com
From our sponsor:

French growth still lagging; is economic improvement on the way?

France is having a difficult time generating economic growth. While PMI indicators show signs of stabilization, economic data in general has not been great  Consider the unemployment rate for example. Even Italy, who has undergone a severe recession and some political turmoil (see post), is showing some slight improvement.


French unemployment on the other hand is trending in the wrong direction. August data will of course provide further insight.


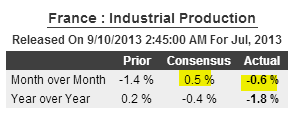
Today the INSEE reported that industrial production for July declined quite sharply, which came as a complete surprise to economists who track the euro area progress.

Source: Econoday

Just to put things in perspective, Germany saw its industrial production rise by 2.4% over the same period. The French factory output growth moving into the red is particularly disappointing, given the recent upward momentum.

Source: INSEE

There is some hope however that this weakness may be transient. French large cap equities (CAC40) have been outperforming other European shares (Euro STOXX 50) starting earlier this year. Is the market signaling better days ahead for the French economy? We should know more by the end of the month, as a number of key economic indicators (French manufacturing PMI, business confidence, consumption, etc.) will provide better guidance.


SoberLook.com
From our sponsor:

Monday, September 9, 2013

What caused the belly of the treasury curve to become more volatile?

While yields on treasury notes and bonds have risen across the board in 2013, the jump in rates has been uneven. The 5-10-year rates - the "belly" of the curve - have increased materially more than other maturities.


Furthermore, the volatility of rates across the different maturities has also been exhibiting a similar pattern, with the yields in the belly of the curve becoming substantially more volatile.


But it hasn't always been this way. The chart below shows how the 7, 10, and 30-year volatility evolved over time.


There was an inflection period early this summer, when the 7-year yield volatility spiked above all the rest. What caused this adjustment? Some of this of course is the selloff related to the Fed's treasury holdings. With fewer purchases of certain bonds, the demand is expected to decline, pushing yields higher.

But there is another explanation. Back in June we discussed the so-called "convexity hedging" (see post). When rates began to rise, MBS durations extended, as mortgage refinancing slowed. And as rates kept increasing, higher coupon MBS became more vulnerable to extension risk. Those with a 4.75% mortgage could still refinance earlier in the summer, but the window on that mortgage closed quickly. MBS holders who saw no need to hedge in the past couple of years had to start shorting treasuries to match their increasing portfolio durations. And intermediate-term treasuries have been the choice hedging instrument. Note that a 30-year treasury is not a good hedge for a 30-year mortgage because the probability of homeowners holding on to their mortgage to maturity is quite low - a shorter instrument is therefore required.

The spike in MBS volatility early in the summer (chart below) increased hedging activity, disproportionately raising the volatility (and yields) of the belly of the treasury curve. This hedging is what created the inflection in the chart above.


SoberLook.com
From our sponsor:
Related Posts Plugin for WordPress, Blogger...
Bookmark this post:
Share on StockTwits
Scoop.it