Showing posts with label Economic Surprise Index. Show all posts

Wednesday, November 28, 2012

Business confidence volatility is unhealthy for economic growth

The ISI Group combined four US regional Fed indices with Markit Manufacturing PMI to create a comprehensive US manufacturing index (chart below). A pattern of growth starts followed by fairly sharp corrections emerges. Some have speculated that this volatility, at least in part, can be explained by the Eurozone uncertainty flare-ups: Greece (2010), Italy (2011), Spain (2012). The pattern also exists in the economic surprise indices (see post-1 and post-2).

Source: ISI Group

What's particularly concerning is that subsequent recovery has not been as strong as the previous "cycle". Businesses are becoming increasingly skeptical about spurts of growth. A similar pattern can also be seen in the ISM Business Confidence measure.

Source: Tradingeconomics.com

Anecdotal evidence suggests that the current "cycle" will not go into its full upswing until there is clarity with respect to the US fiscal situation.  But already some are talking about a strong first quarter of 2013 induced by Hurricane Sandy reconstruction expenditures - and then possibly another dip next summer, repeating the pattern once again. In the long run, this volatility in confidence is highly undesirable because it inhibits capital investment and hiring, forcing corporations to sit on cash (or pay cash out in dividends).


SoberLook.com
From our sponsor:

Wednesday, November 14, 2012

EU, US economic surprise indices diverge

The US and Europe economic surprise indices have diverged dramatically recently. After the weakness in new orders during the summer, economists have lowered expectations for the US, but were since consistently surprised to the upside. In Europe the falling sovereign borrowing costs made some forecasters more sanguine about prospects for a recovery, which did not materialize. Instead the Eurozone saw consistent deterioration in the "core" economies (see discussion).

Source: JPMorgan

As an example of expectations that were too optimistic, Germany's factory orders, industrial production, and the ZEW Index (see post) showed that Germany has been unable to decouple from the periphery (see post). All three indicators helped lower the Europe Economic Surprise Index.

Germany Factory Orders (source: Econoday)

Germany Industrial Production (source: Econoday)

Germany ZEW Index (source: Econoday)

Forecasters are now adjusting their expectations and this divergence between the two surprise indices should narrow in the coming months.


SoberLook.com

Wednesday, October 31, 2012

Spooky Halloween surprise from Goldman

The Goldman Sachs Analyst Index (GSAI) hit a new post-recession low this month. The index is a composite of corporate outlook by industry from Goldman's company research. In the past, the index generally fell in line with other economic activity indices such as ISM Manufacturing - but not recently. While the ISM index is showing a slight expansion (though we don't yet have the October ISM number), GSAI is pointing to the sharpest contraction across US industries since 2009. Sales, shipments, new orders - all came in weak. This indicates that the positive economic numbers in September (see discussion) may have been an aberration.
GS: - The Goldman Sachs Analyst Index (GSAI) tumbled to 32.9 in October from 44.1 in September. Underlying components also fell across the board, suggesting depressed business activity from the bottom-up.
...
In addition to the headline index, most of the underlying components of the GSAI also fell sharply. The sales index gave back its gain in September, falling 12 points to 36.4 in October from 48.4, registering the fifth consecutive month below the 50 mark. Similarly, the new orders index fell 15.4 points to 26.3 from 41.7, contributing 4.6 points alone to the headline drop. The inventories index saw the lone gain, rising 1.6 points to 43.3. Consequently, the orders-inventories gap fell back into negative territory at -17.0 versus flat in September. The sharp reversal in the sales, new orders, and orders-inventories gap measures suggest that the broad improvement in September was likely transient, and that activity and demand will likely remain depressed despite tight inventories.
Source: GS

This points to significant downside risk to the ISM Manufacturing number that comes out tomorrow (Thursday). Another troubling indicator from GS is the GSAI Employment Index - a component of the overall GSAI measure.

Source: GS
GS: - The employment index fell for the second consecutive month to 39.3 from 45.3 in September. This is the lowest index level since February 2010, and—similar to weakness in the employment component in the Empire State and Philadelphia Fed surveys—continues to point to a slow recovery in the labor market. While the September employment report showed encouraging improvements particularly from the household side, the pace of improvement is unlikely to sustain; we expect only a moderate gain of 125,000 in nonfarm payrolls in the October employment report on Friday.
Based on the GSAI indicators, we could be looking at a series of negative economic surprises as October economic numbers are released next month. Economic activity and corporate earnings in Q4 may in fact end up being far less rosy than many expect.


SoberLook.com

Friday, October 12, 2012

Intrade and electoral votes still show Obama in the lead; economy will drive odds going forward

After a sharp decline, the Obama victory odds on Intrade seem to have have stabilized at around 63% (chart below). The betting market was pricing in a poor performance by Biden (who has been known to "put his foot in his mouth"), which by most measures was not the case last night.


Once again, in spite of Romney leading in the major polls (Gallup: +2, Rasmussen: +1, IBD/TIPP: +1, Monmouth: +1), Obama continues to lead in the projected electoral votes - which is what Intrade reflects. Welcome to a republic.

Source: RealClearPolitics.com

Going forward the debates will become less impactful, as was the case during the Republican primaries. At this stage the focus is going to be almost entirely on the economy (as has been the case with most incumbents historically - has little to do with ideology, etc.). Economic data thus far has been helping the Obama camp (although another spike in gasoline prices could do some real damage). The recent jobs data (whether real or not; discussed here and here) as well as today's sharp increase in consumer confidence to the pre-recession levels (see Lee Adler's discussion) explains why the president's odds are still at these levels. Broader economic measures point to this fact as well, as reflected by a steady climb of the Citi Economic Surprise Index (discussed here).

Citi Economic Surprise Index

According to a number of economists the sharp decline in orders last quarter (discussed here) may have been a Eurozone induced "air pocket".
JPMorgan: - ... it looks most likely that last quarter’s sharp declines in capital goods orders represents an air pocket that will be followed by a lift back toward cruising altitude into year-end.
As difficult as things still are for the US consumer, American economic activity continues to be ahead of the global averages. And as long as these economic trends stay intact, the president will retain his lead, at least as measured by the betting markets.

Source: JPMorgan

Update: Here is the latest chart from DB that shows the probabilities of various elections outcomes:

Source: DB


SoberLook.com

Friday, October 5, 2012

Citi Economic Surprise Index spikes

Today's employment report has sent the Citi Economic Surprise index sharply higher.

Citi Economic Surprise Index


This is building on earlier momentum from stronger than expected US economic indicators such as the ISM PMI results.

Manufacturing (white) and Non-manufacturing (yellow) ISM PMI

There is no question that the US economy is not going to experience the type of contraction seen in Europe. But slow growth of 2% and under is the "new normal".


SoberLook.com

Thursday, September 27, 2012

Worse than expected economic data sent Citi economic surprise index sharply lower

A massive monthly decline in US durable goods orders in August once again demonstrated the vulnerability of the US manufacturing sector. The 13% MoM drop is only rivaled by declines during the 08-09 crisis. Granted, a large portion of this was driven by aircraft orders, but it is worrying nevertheless.

US Durable Goods New Orders Industries MoM SA

This release, combined with other poor economic numbers from today have sent the Citi Economic Surprise Index sharply lower.

Citi Economic Surprise Index

Here is a good recap of today's data. One surprise came from lower than expected GDP, which was in part caused by the North American drought.
SFGate/AP: - 
— Companies cut orders for long-lasting goods by 13.2 percent in August, the Commerce Department said. That was the biggest drop in more than three years but it was largely influenced by a 102 percent decline in volatile aircraft orders. Excluding transportation equipment, orders fell only 1.6 percent. And in a positive sign, orders in a category that reflect business investment plans rose 1.1 percent, the first increase since May.

— The overall economy grew at a 1.3 percent annual rate in the April-June quarter, much lower than the 1.7 percent the government previously estimated. About half of the downward revision stemmed from the severe drought in the Midwest, which cut overall farm output. But growth also fell because exports and consumer spending expanded at a slower pace.

— The number of Americans who signed contracts to buy previously occupied homes fell in August from a two-year high in July. The National Association of Realtors said its index of sales agreements declined 2.6 percent to 99.2. That's just below the reading of 100 that is considered healthy. Still, the index is 10.7 percent higher than a year ago.

... Weekly applications for unemployment benefits plunged 26,000 to a seasonally adjusted 359,000, the lowest level in two months, the Labor Department said. The four-week average, a less volatile measure, fell to 374,000.


SoberLook.com

Friday, September 7, 2012

Economic Surprise Index has turned positive

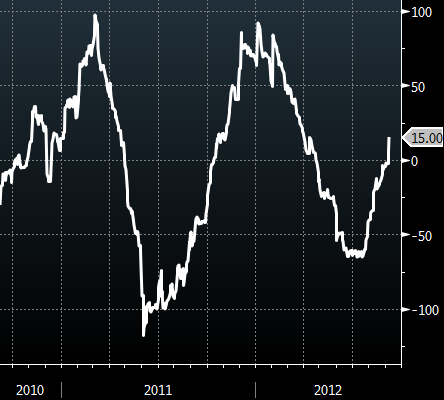
The Citi Economic Surprise index was fairly accurate in pointing to a US slowdown in the first half of 2012. One therefore should not dismiss the recent reversal in the indicator's trend. The index just went into the positive territory in spite of today's poor employment report.
Washington Post: - While today’s jobs data trailed forecasts, better-than- projected reports over the past three months have pushed the Citigroup Economic Surprise Index for the U.S. to an almost five-month high. The index, which measures how much data is beating or missing the median estimates in Bloomberg surveys, climbed to 15 today after yesterday rising above zero for the first time since April.
Citigroup Economic Surprise Index - United States (Bloomberg)

The contributors to the recent uptick include positive surprises from ISM Non-manufacturing Composite, Initial Jobless Claims, US Factory Orders, various housing indices (15% YoY in pending home sales for example), chain store sales, and auto sales. Growth in the US is clearly subpar, but the economy is not headed for a "double-dip" as many had predicted. People also need to come to terms that slow growth, driven by weak global demand, is the "new normal".


SoberLook.com

Thursday, June 21, 2012

Summer of 2011 redux?

The Citi Economic Surprise Index continues its relentless slide. The US PMI (52.9 vs. 53.3 expected), the Philadelphia Fed Diffusion Index (-16.6 vs 0 expected), Empire Manufacturing, Industrial Production, etc. are all coming in below expectations. It would seem that economists would adjust their forecasts by now, but that hasn't happened.

Citi Economic Surprise Index

This is somewhat reminiscent of last summer when a mix of US budget issues and fears in Europe increased market volatility and put downward pressure on economic activity.

SoberLook.com

Friday, June 1, 2012

A hidden surprise in the US employment report

Today's employment report brought with it all sorts of negative economic surprises, creating a sharp drop in the Citi Economic Surprise Index.

Citi Economic Surprise Index
Bloomberg: - The Citigroup Economic Surprise Index for the U.S., which measures how much data is missing or beating the median estimates in Bloomberg surveys, fell to minus 53.6, the lowest since September. It turned negative this year in April after remaining above zero since October. The Federal Reserve announced a program dubbed “Operation Twist” to boost growth on Sept. 21, 2011, four months after the index turned negative.
One of the worst surprises buried in the report however was the fact that all the job growth came from increases in part-time jobs. The number of full-time jobs actually declined significantly.
WSJ: - ... the job growth is coming entirely from workers getting part-time jobs. The number of Americans working full-time fell by 266,000 in May, erasing all the gains of the past three months. The total employment figure only rose because 618,000 more people got part-time jobs. Many of those people would rather be working full-time: The number of people classified as “part time for economic reasons” — meaning they’re working part-time because they can’t find a full-time job — rose by 245,000 to 8.1 million.

SoberLook.com

Sunday, May 6, 2012

Economic surprise index eerily reminiscent of last year

The Citigroup economic surprise index is now clearly in the negative territory in a trend reminiscent of last year's decline.

Citi Economic Surprise Index

BW/Bloomberg: - The Citigroup Economic Surprise Index for the U.S., a gauge of how much reports differ from economists’ estimates in Bloomberg surveys, turned negative on April 25 and fell May 3 to the lowest level since September. Last year, the gauge sank below zero for the first time in five months on May 2, the day when the S&P 500 began a 19 percent drop.
Given the rising concerns out of Europe today, there is a strong possibility we may be looking at sharply higher market volatility. As discussed back in March, the VIX futures curve steepness earlier in the year seemed to be a good predictor of uncertainties in the post-LTRO environment.


SoberLook.com

Monday, March 26, 2012

The Economic Surprise Index is now trending down

Notice how the US economic data coming out lately has been quite mediocre relative to expectations? For example, today's pending home sales came in -0.5% vs. +1% expected. Dallas Fed manufacturing activity came in at 10.8 with 16 expected. Citi has an index that tracks economic data surprises. Here is the definition:
The Citigroup Economic Surprise Indices are objective and quantitative measures of economic news. They are defined as weighted historical standard deviations of data surprises (actual releases vs Bloomberg survey median). A positive reading of the Economic Surprise Index suggests that economic releases have on balance beating consensus. The indices are calculated daily in a rolling three-month window. The weights of economic indicators are derived from relative high-frequency spot FX impacts of 1 standard deviation data surprises. The indices also employ a time decay function to replicate the limited memory of markets.
The index is now trending lower as the negative surprises are starting to weigh it down. The US economic forecasters have gotten a bit ahead of themselves, which may indicate a need for caution.

Citigroup Economic Surprise Index (Bloomberg)
SoberLook.com
Related Posts Plugin for WordPress, Blogger...
Bookmark this post:
Share on StockTwits
Scoop.it