Showing posts with label M2. Show all posts

Monday, November 3, 2014

Decomposing the velocity of money

We've received some questions about the ongoing declines in the velocity of money in spite of stronger US GDP growth in the past couple of quarters.


The velocity of money (as calculated by the Fed) is the ratio of quarterly nominal GDP to the quarterly average of money stock (M2 in this case). It's one of the measures used to assess how quickly money in circulation is used for purchasing goods and services.

The broad money stock growth in the US is currently quite close to its 30-year average of around 6% per year.


On the other hand, the nominal GDP gains in the US have been materially below historical averages. The ratio of Nominal GDP to M2 has therefore been declining.


However, with US inflation subdued, a relatively low nominal GDP increase has recently translated into decent real GDP results. Going forward, as long as inflation remains low, we could continue to see reasonable real GDP growth while the velocity of money remains depressed.

_________________________________________________________________________


SoberLook.com
Sign up for our daily newsletter called the Daily Shot. It's a quick graphical summary of topics covered here and on Twitter (see overview). Emails are distributed via Freelists.org and are NEVER sold or otherwise shared with anyone.


Sunday, January 12, 2014

Growth in loans at US banks continues to weaken

Loan growth in the US continues to slow. Credit expansion is certainly not nearly as bad as what has transpired in the Eurozone (discussed here), but the slowing trend is unmistakable. The current rate of loan growth is now significantly below the nominal GDP expansion.

Source: FRB (adjusted for the FASB 140 accounting change)

One exception may be the corporate sector, where loan growth has been robust (see story). But as percentage of banks' total balance sheets, business loans are not growing. In fact much of the corporate debt growth is actually coming from outside the banking system (see post on shadow banking).

Many expect that bank balance sheets will remain constrained by the new regulatory framework (Basel II, etc.), with loan growth continuing to stay weak. As a result, the increases in US broad money supply (M2) have slowed as well.


This is one of the reasons inflation in the US has been subdued in spite of massive injections of liquidity by the Fed.


SoberLook.com
From our sponsor:

Sunday, December 29, 2013

US broad money supply growth slows

The US broad money supply expansion has slowed materially in the last few months, with the year-over-year growth now at the lowest level since mid 2011. Except for certain components of M2 such as money market funds, the broad money supply is an indicator of the nation's overall credit expansion. This may, at least in part, explain the relatively low inflation the US has experienced in recent months (see post).


SoberLook.com
From our sponsor:

Monday, June 17, 2013

Chart that seems to violate key principles of money creation

The chart below shows a clear divergence in trends of the total loans and leases on US banks' balance sheets and the broad money supply measure (M2). Loan balance growth is slowing, while the money supply keeps growing at a steady rate of around 7%.

Source: FRB (H.8)
This is enough to give some economists nightmares. That's because they may view this divergence as a violation of principles they hold dear. Many still believe that bank loan balances and M2 money supply have to be tightly linked because the creation of deposits (the money supply) is entirely tied to lending. And this chart shatters that belief.

But in spite of the divergence in the chart above, the "loans create deposits" axiom still stands - deposits are still created through bank credit. What's at play here is shadow banking. Two key developments explain much of this divergence without violating these principles.

1. Loans on banks' balance sheets do not represent the entirety of credit creation. Loans originated by banks increase deposits, but banks often sell some loans into the shadow banking system, such as Fannie and Freddie. A material portion of these mortgages then ends up back on banks' balance sheets in the form of Agency MBS. These securities are exempt from the Volcker Rule, allowing banks to hold substantial amounts. That process reduces total loan balances without reducing deposits, thus contributing to the divergence in the chart above.


2. As discussed before, M2 includes another form of shadow banking - retail money market funds. These funds have seen their AUM rise recently due to increased risk aversion, particularly in fixed income (see last chart in this post). That development has added to M2 growth without increasing loans on banks' balance sheets.

So our friends in the economics profession should be able to sleep well at night. The divergence between the trajectories of M2 money supply and bank loan balances has explanations that do not violate key principles of money creation.


SoberLook.com
From our sponsor:

Sunday, June 2, 2013

Misreading the tea leaves of the broad money supply

Some economists continue to misinterpret the recent movements in M2, one of the measures of the US broad money supply. People use this indicator to argue all sorts of things - from a slowdown in lending to the reason for low inflation and even as a harbinger of a major correction in equities. While such conclusions could certainly end up being correct, it is unlikely that the movements in M2 have anything to do with it.

First of all, what exactly is M2? The chart below shows the components (one item not shown is the amount in travelers checks - too small to be displayed on this chart).

"Small CDs" = under $100K; "Currency" = physical bills

The money supply is one of those measures that is not supposed to be impacted by asset rotation. For example if you use your cash to buy a car or a stock, someone else will have your cash - so the overall amount of cash in the system has not changed. If people move money from savings to checking, the aggregate once again should stay the same.

In theory this factor would be impacted primarily by banks lending money. For example, Sarah deposits $100 at a bank. Frank borrows $90 from the same bank and deposits it there (maybe temporarily). Now deposits have increased from $100 to $190, which would show up in M2 (and the bank has increased its leverage ratio).

But there are two components of this measure that cloud this logic: Certificates of Deposit (CDs) and Money Market Funds. If funds come out of these two categories and get deployed in say a short-term bond fund or a stock fund for that matter, M2 would decline. That is if Sarah swaps her CD for a mutual fund, (unwinds the CD or lets it mature and uses the proceeds to buy the fund), the cash balance does not change but the CD amount in the system declines. That will result in lower M2.

We know that both money markets funds (see discussion) and CDs (see discussion) have seen material declines recently. People move funds from these two categories into high yielding savings accounts as well as to bond funds and recently stocks (rather than into another CD). The net effect is lower CD amount outstanding and slower than expected growth in M2 - which is unrelated to bank lending.

Looking at how the components of M2 changed over the past 3 months (chart below), we in fact see the declines in these two categories.


From this measure alone we can't tell how much of the declines in CDs and money market funds went into deposits and how much ended up in bond funds or stocks. We do know however that mutual fund inflows have been strong across the board recently.

Source: ICI

Whatever the case, lower CD and money market amounts outstanding result in a reduction to M2. Some economists prefer using MZM rather than M2, which excludes CDs but includes institutional money market funds instead. Institutional money funds however have also been declining (as the SEC pushes to implement regulatory changes that will result in these funds fluctuating in value.) Therefore MZM is impacted by this "asset rotation" as well, although potentially at a different rate. Therefore, before reading too much into the movements in broad money supply measures, one should consider the components of these indicators and what the changes in the components really tell us.


SoberLook.com
From our sponsor:

Sunday, May 19, 2013

Fed's action won't influence deposit growth

A quote from an elevator mechanic in NYC: "You need to push the 'up' button to make the elevator come up. But pushing the button many times is not going to make the elevator move any faster."


We continue to receive emails pointing to what some have called "a broken monetary transmission" in the US. On the surface the argument looks compelling. The Fed's securities purchase program is expanding the monetary base - the amount of dollars in the system. In theory some of those extra dollars should encourage the banking system to extend more credit than it normally would, ultimately growing the broad money supply (M2 for example). But that's not how things turned out.

Unit = $ Billion

The argument goes that the banking system is broken and is unable to grow credit - which is being manifested as tepid growth in the broad money stock. Is that what's really going on here?

A closer look reveals that the slow growth in M2 is driven primarily by the leveling off in the amount of deposits in the US banking system (in the chart below the monthly fluctuations reflect the payroll cycle). Note that the spike at the end of last year is the "income harvesting" prior to higher tax expectations (see post).

Deposits in the US banking system (NSA, source: FRB)

But is this leveling off in deposits that unusual? How does it compare to changes in total deposit balances across US banks over longer periods? It turns out that the growth of deposits in the United States has actually been fairly steady - roughly 6.8% per year over the long run. The chart below shows a fit to 40 years of weekly deposit data.


While deposit growth fluctuated over time, it has maintained a steady growth trajectory. Recessions, market booms, Fed's policy, reserve requirements, etc. have had a relatively minor impact on deposit expansion in the long run. And based on this fit, we are currently right about where we should be in terms of the overall deposit levels.

The assumption that the banking system can generate unlimited amounts of broad money simply because the banks have been injected with record levels of reserves is wrong. Banks' capacity to grow credit has always been limited, and it's no different this time. The "monetary transmission" is not broken - it is simply constrained.

The recent fluctuations are due to flows into stocks, mutual funds, short-term income funds (see post), etc. Deposits in the system will continue to grow at roughly 6.8% a year as they have done for the past 40 years, possibly longer.  Therefore the broad money supply - a great deal of which are deposits - will never keep up with recent unprecedented growth in the monetary base (which is up 18% YoY). The elevator "isn't going to move any faster".


SoberLook.com
From our sponsor:

Sunday, April 21, 2013

Rotation out of money market funds - where is the cash going?

Investors are fleeing dollar-based money market funds. After the spike in cash holdings from taxable income "harvesting" at the end of 2012 (see discussion), the assets in money funds have declined sharply.

Source: ICI

What's causing this decline? The common explanation has been a major rotation into equities. That certainly explains some of it, but there is more to the story. Some institutional investors are becoming uneasy about the impending money market funds regulation. Not only are investors paid a near zero rate on their money market holdings, they also may be subject to some NAV fluctuations in the near future. Furthermore, the NAV fluctuations may only be applied to funds holding commercial paper and not to those holding just treasury bills or treasury repo.
Reuters: - Two-tier money market fund reform is as clear as mud. The U.S. Securities and Exchange Commission is trying again to regulate these mutual funds, which compete with bank deposit accounts. But the rules could favor funds that invest in government debt over those buying corporate debt.

The SEC isn't talking specifics, but Larry Fink, chief executive officer of BlackRock, is. He told analysts this week that some funds may have to adopt a floating net asset value (NAV) - a standard in the mutual fund industry but anathema to those running these accounts that invest in short-term debt. That's because investors, who view money market funds as higher-yielding savings accounts, could actually lose money if NAV is no longer pegged to $1 per share. But the scheme is the best option floated by regulators who want to stop 2008-like runs from happening again. It's simple and puts risk back where it belongs: on investors.

But, according to Fink, it seems a floating NAV may not be applied to funds that invest in government debt like U.S. Treasuries. In a letter to regulators last December, BlackRock argued these funds, which represent 45 percent of the $2.5 trillion market, should be exempt. After all, they weren't part of the panic in 2008, which forced the government to bail out the industry with a blanket guarantee.
...
It's not clear why there need to be two sets of rules for money market funds, other than the need to get a deal done. The effort to reform money market funds has been a long slog. And the SEC has already failed once to overhaul the industry. Compromise may be necessary, but it shouldn't come at the expense of sensible regulation.
The whole attraction of money market funds has been the stability of principal. But with this type of regulatory risk, investors may be better off moving cash into short-term bond funds or ETFs. If one is going to be subject to volatility, why not hold money in something like the PIMCO Enhanced Short Maturity Strategy ETF (MINT), yielding 75bp. That's in contrast to PIMCO's Institutional Money Market Fund (PMIXX) which pays precisely zero, while its NAV may drop below par.

Not surprisingly, that's precisely what investors have been doing. In March short-term bond mutual funds and ETFs have clocked the largest inflow since 2009.

Source: JPMorgan

One unintended consequence of this shift to bond funds will be perturbations in some measures of money supply. Money market funds traditionally have been included in certain broad measures of money stock (such as MZM) while bond funds have not. The definition of "cash equivalents" have now been blurred further. Just watch certain high-profile economists in the next few months mistakenly interpreting this "rotation" as a slowdown in the growth of US money supply.

SoberLook.com
From our sponsor:

Sunday, April 7, 2013

Why has the US broad money supply flat-lined in 2013?

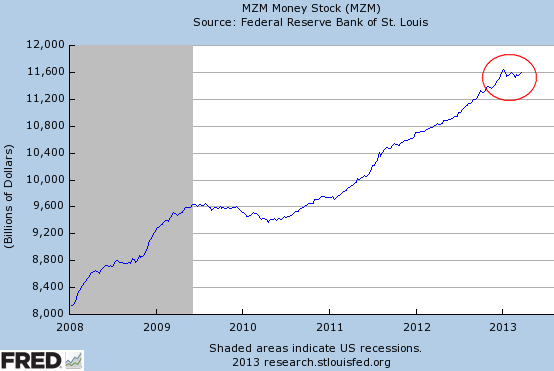
The US money indicators have been showing something odd in the last few months. While the monetary base (M0) has been rising sharply due to increasing bank reserves (the liability side of the Fed's balance sheet), the broader money supply has stalled.


Both M2 and MZM measures of money stock have been relatively flat this year.


Some attribute this to limited bank lending driving the so-called velocity of money lower, "trapping" liquidity from entering the broader economy. That would explain the growing monetary base and stagnant M2 and MZM.

But stalled credit growth can not be the explanation - simply because bank lending in the US continues to increase at a fairly constant pace since mid 2011.

Loans and leases for all commercial banks chartered in the US (source: FRB)

The answer has to do with cash balances, particularly in money market funds. The amount of cash in dollar money market funds has declined sharply since the beginning of the year. The retail accounts show a particularly large relative drop.


Source: ICI

In preparation for higher federal taxes, both individuals and institutions took capital gains, received special dividends, and pushed incomes into 2012 where possible (see discussion). And these accounts have been deploying this cash from the beginning of the year - with a big chunk of it apparently going to equities. That should explain part of the equities rally we've had this year.

In fact a closer look at the broad money supply trend shows that the growth has been fairly linear except for the late 2012 jump which has dissipated this year. That's why the broad money supply looks flat from the beginning of the year. Here is another example of "unintended consequences" of government policy and policy uncertainty.


Now that the excess liquidity has essentially been used up, what does it say about the stock market rally going forward?


SoberLook.com
From our sponsor:

Saturday, December 31, 2011

The ECB's easy monetary policy is not getting to the "periphery"

The monetary contraction in Italy has been continuing, with money supply indicators all showing negative growth.  Here are the latest monetary aggregate contributions to the eurozone from Italy's central bank:

 Banca D'Italia: Italy's contribution to the eurozone money supply (percent YOY)

But shouldn't the ECB's continuing expansion of the balance sheet have some positive impact on Italy's liquidity?  Below are the money supply measures showing year over year growth for the eurozone as a whole.

ECB: total eurozone monetary aggregates growth YOY

The growth is moderately positive at around 2% year over year.  This means the liquidity in the eurozone as a whole is expanding, while Italy's is contracting.  But the eurozone is a "closed system" - if the monetary conditions are contracting in one nation, they must be expanding elsewhere to keep the whole euro area liquidity growing at the 2% level.

As expected, that monetary expansion is in fact taking place in Germany with M2 and M3 growth rates in the 6-7% range.


Bundesbank: Germany's contribution to the eurozone monetary aggregates (percent YOY)
What this shows is that liquidity is not getting to the ECB's target, the "periphery", whose economies are facing a recession.  Instead the monetary expansion is ending up at the "core", making the ECB's policy of easing far less effective. This disparity is also setting up a potential future conflict between Bundesbank and the ECB as the impact of monetary policy is not felt uniformly across the eurozone.

SoberLook.com
Related Posts Plugin for WordPress, Blogger...
Bookmark this post:
Share on StockTwits
Scoop.it