Showing posts with label leveraged finance. Show all posts

Friday, September 12, 2014

Bubble forming in US middle market leveraged finance

US middle market leveraged buyout (LBO) transactions are becoming increasingly frothy. According to the latest data from Lincoln International, risk-return fundamentals in the space are worse than they were in 2007. Here are some disturbing facts about leveraged transactions in US middle markets:

1. Leverage multiples (debt to EBITDA) are higher than at the peak of the bubble in 2007. In particular, leverage through the senior debt (dark blue) is now materially higher.


2. Yields on senior leveraged loans for middle market deals are now significantly lower than in 2007. Investors are not getting paid for taking on riskier loans.


3. Furthermore, private middle market company valuations (as a multiple of EBITDA) are at record levels.


4. Banks have all but exited leveraged loan origination, as institutions (shadow banking) have taken over. These institutions include loan funds (mutual funds and closed-end funds), BDCs, CLOs, hedge funds, insurance firms, pensions, etc. However, since the Fed is mostly looking at banks' balance sheets, the central bank seems to be unconcerned about the froth in this market.


5. According to Lincoln International, there are signs that leveraged middle market firms are experiencing margin compression. That is worrisome given the amount of leverage these firms have.
Lincoln International: - While over 50% of companies are seeing revenue growth, the fact that over 50% are experiencing EBITDA declines suggests margin compression. For the sixth consecutive quarter, more middle market companies experienced EBITDA declines than gains.
The Fed has allowed for bubble to build in the US corporate sector - particularly in leveraged middle market companies. A broad hit to revenues could create a massive wave of failures, as firms become too leveraged to withstand such a shock. At the same time investors could face significant losses without being compensated for the risk they are taking. Let's hope someone on the FOMC is paying attention.


_________________________________________________________________________


SoberLook.com
Sign up for our daily newsletter called the Daily Shot. It's a quick graphical summary of topics covered here and on Twitter (see overview). Emails are distributed via Freelists.org and are NEVER sold or otherwise shared with anyone.


From our sponsor:

Friday, June 6, 2014

Worsening risk/reward fundamentals in US corporate credit

US corporate credit markets, particularly high yield bonds, are becoming quite frothy, as risk/reward dynamics continue to worsen. Here are some key indicators:

1. In the last couple of years high yield supply has been massive relative to equities. HY has had no shortage of buyers thus far, but the market is becoming increasingly comfortable with the primary market buyers always being there. Investors are ignoring the fact that such demand may not always be the there.

Source: Barclays Research

2. High yield bond spreads have declined to new post-recession lows, with the latest spread tightening driven by yesterday's ECB's easing. Bond holders are simply not being compensated for the risk they take.


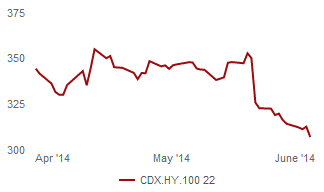
3. Similarly, corporate credit default swap spreads are falling as well. Here is what CDX (index of CDS) spreads have done recently for both investment grade and HY indices.

Investment grade CDX spread; current on-the-run series (source: Barclays Research)

High yield CDX spread; current on-the-run series (source: Barclays Research)

4. Valuations in the most leveraged and lower quality portion of the credit spectrum have risen dramatically. Over 60% of corporate bonds rated CCC by Fitch now trade above par.

Source: Fitch Ratings

To be sure, improving economic fundamentals in the US have reduced default risks considerably. But we are now back to the days when the ability to refinance is taken for granted and current cash flow to service debt is starting to become less relevant. With banks' ability to hold inventory impaired, these markets are becoming quite vulnerable to a sharp correction.

___________________________________________________________________________
SoberLook.com
Sign up for our daily newsletter called the Daily Shot. It's a quick graphical summary of topics covered here and on Twitter (see overview). Emails are distributed via Freelists.org and are NEVER sold or otherwise shared with anyone.


From our sponsor:

Sunday, June 1, 2014

Failure of Guidance on Leveraged Lending resembles the War on Drugs

About two years ago the various US bank regulatory agencies (the OCC, the FDIC, and the Fed) have started pushing through the so-called Guidance on Leveraged Lending. They were alarmed at the rising leverage and weaker covenants (see post) in new sub-investment grade corporate finance transactions that involved senior loans.
US Regulators (March 2012): - Credit agreement covenant protections, including financial performance (such as debt to cash flow, interest coverage or fixed charge coverage), reporting requirements, and compliance monitoring. Generally, a leverage level after planned asset sales (i.e., debt that must be serviced from operating cash flow) in excess of 6x for Total Debt/EBITDA raises concerns for most industries.
The guidelines ultimately went into effect, as US regulators made it known that they will be watching these transactions closely. Particular emphasis has been given to the "6x" leverage cutoff that regulators view as the "danger zone".
Bloomberg (October 2013): - The Federal Reserve and the Office of the Comptroller of the Currency sent letters to some of the biggest U.S. banks asking them to avoid arranging debt that may be classified by regulators as having some deficiency that may result in a loss, according to nine people with knowledge of the communication.
Of course a great deal of this paper is not held on banks' balance sheets and instead sold to CLOs, traded loan funds, and other asset managers. What the regulators fear however is that a major market disruption will prevent banks from unloading this risk, resulting in "hung" deals that could jeopardize bank stability.

Recently, Deutsche Bank researchers took a closer look at how effective the Guidance on Leveraged Lending policy has been. What they found so far is that this regulatory effort does not seem to have much of an impact at all, as the percentage of loans with leverage of 6x and above continues to rise.

"Pct of Deals" = percentage of  the number of leveraged finance transactions with leverage > 6x
"Pct of Face" = percentage of  the face value of leveraged finance transactions with leverage > 6x
Deutsche Bank: - Aggressiveness of new deals has been rising consistently over the past few years, and currently stands at levels similar to those last seen in 2006 as measured by both of these datasets.
Part of the problem with this failed regulatory effort is its similarities to the so-called War on Drugs. The demand for yield has been so strong lately that cutting off supply remains extremely difficult and will take time. Instead the Fed should be focusing on the demand side of the equation. By raising interest rates more aggressively, the Fed could improve fixed income yields, thus reducing the need to chase such high-risk paper.
Deutsche Bank: - ... while we realize that it takes time for the market to conform to new leveraged guidance and future disciplinary actions by regulators will help such an adjustment gain its urgency, the single most important action the Fed can take in addressing these trends is to continue normalizing monetary policy faster rather than slower. The reach for yield in leveraged finance, after all, is primarily a function of scarcity of yields in other markets.


SoberLook.com
IMPORTANT: We require that any re-published posts preserve ALL embedded links to previous Sober Look and Twitter posts. Sober Look represents an ongoing discussion which relies on continuity as well as references to key external materials.

From our sponsor:

Wednesday, January 29, 2014

HY bond market weathering the storm

The US corporate high yield market remains incredibly resilient in the face of increasing global volatility. Year to date the broad HY index has outperformed the S&P500 by over 4.25%.

SPY = SPDR S&P 500 ETF; JNK = SPDR Barclays High Yield Bond ETF (source: Ycharts)

One reason for this stability is the strong performance of the treasury market this month. Also many investors have become quite comfortable (perhaps too comfortable) with junk debt. Part of the reason is the low default rates recently as well as vibrant primary markets that have been willing to refinance (roll) maturing debt. In addition, supply of new bonds has been relatively light, while fund inflows remain robust (see story). As a result HY spreads are less than 10bp higher than they were at the end of last year.

Experienced analysis and investors in this space openly admit that it's just a "matter of time" before this market "cracks". It simply needs a catalyst, such as a large unexpected corporate default. Maybe a major event in the sovereign bond market could dislodge HY. Short of that, junk bonds could remain at frothy valuations for some time. 


From our sponsor:

Sunday, November 3, 2013

Covenant-light loans on the rise

The demand for corporate leveraged loans from both institutional and retail investors (described here) continues to stay unusually strong. Senior loan closed-end funds, BDCs, CLOs, hedge funds and even insurance firms are clamoring for senior loans of sub-investment-grade companies. Some view this asset class as one of the few "taper-proof" fixed income products because of the floating rate coupon and low default rates. Loan issuance has spiked this year to meet all the demand - in some cases at the expense of the high yield bond market.

Source: Deutsche Bank

The higher demand for this product is helping to gradually increase leverage of buyout transactions (see chart). But a more alarming trend is the sharp relaxation of lending terms - the so-called "cov-lite" (covenant-light) deals. Over 70% of recent deals for example have been structured as covenant-lite.

Source: Deutsche Bank

And according to LCD, these types of loans now represent nearly 45% of outstanding loans - a number that is significantly higher than during the LBO boom of 2007.

Source: LCD

US regulators have taken notice of the situation and are trying to get US banks to cut back on cov-lite transactions.
Bloomberg: - The Federal Reserve and the Office of the Comptroller of the Currency sent letters to some of the biggest U.S. banks asking them to avoid arranging debt that may be classified by regulators as having some deficiency that may result in a loss, according to nine people with knowledge of the communication.

Regulators are seeking to cut down on excessive risk taking as typical lender protections have been stripped from credit agreements at a record pace. Speculative-grade borrowers have raised $239.6 billion of covenant-light loans this year, more than double the amount in 2012, Bloomberg data show. The LSTA, whose almost 350 members consist of banks, investors and corporate law firms, said the regulators’ request will hurt the least-creditworthy companies.
...
Covenant-light loans give companies more leeway to avoid a default as they don’t contain financial-maintenance provisions requiring the borrower to meet such restrictions as a set level of debt relative to earnings before interest, tax, depreciation and amortization.
However banks tend to hold very little of this debt and therefore have little incentive to tighten covenants. They structure, syndicate, and collect fees, while the risk moves somewhere else. Many argue that weak covenants don't matter when corporate default rates are as low as they have been recently. Haven't we heard similar arguments in 2006 with another asset class?


SoberLook.com
From our sponsor:

Thursday, October 3, 2013

HY spreads now positively correlated to treasury yields

Here is further evidence that in this environment treasuries are driving "risk asset" valuations. Corporate HY bond spreads are now positively correlated to treasury yields. That's quite unusual because traditionally when treasury yields shrink, spreads rise (negative correlation).

Based on Merrill HY Index

By not allowing treasury yields to rise, the Fed is artificially suppressing HY spreads (as well as other "risky" bond spreads). The corporate market is therefore heavily dependent on stimulus, making any attempt to normalize monetary policy increasingly difficult.


SoberLook.com
From our sponsor:

Tuesday, September 24, 2013

What do CLO managers and retail investors have in common?

The answer is, they both love senior leveraged loans...

The amount of US leveraged senior secured debt outstanding has risen sharply this year. According to LCD this market is now some $630bn in size.

Source: LCD
(the fluctuations include new loans/refinancings as well as partial or full prepayments)

Yet that doesn't seem to be enough. While the M&A activity has picked up this year (Heinz, Dell - see story), the volumes are not nearly sufficient to feed retail investors and CLO managers.
Reuters: - Retail money keeps flooding into loan funds, marking 66 straight weeks of heavy inflows, according to Lipper data. Loan funds pulled in $1.3 billion in the week ended September 18, during which the Fed surprised the markets with its plan to keep on buying $85 billion of bonds weekly to keep rates low and boost economic growth.

Loan fund inflows accelerated over the summer on expectations that the U.S. central bank was about to reduce those bond purchases this month, keeping interest rates rising. Issuance of collateralized loan obligations (CLO), another key source of demand for leveraged loans, at $57 billion so far this year already topped last year's issuance.
This demand continues to keep loan valuations elevated. In spite of the recent selloff across fixed income markets, the leveraged loan index has been pushed to new highs.

Source: LCD

At a recent CLO conference nobody seemed to be too concerned about this. Participants just complained about not getting enough new allocations from the banks running loan syndication. But there are some troubling signs in this market. While leverage on new deals remains well below the 2007 levels, it is starting to creep up as buyers are willing to accept higher risk.

Source: Forbes

Other loan "features" are beginning to look more like 2007 as well.
Reuters: - Conference attendees did note more risky leveraged loan features including payment-in-kind (PIK) toggles, dividend limitations and looser terms cropping up as more investors hunger for relatively higher-yielding assets.
But CLO managers insist that the credit environment remains benign and none of this is a problem.
John Popp (manages CLOs for Credit Suisse): - "At the end of the day, we're most concerned about being paid back, and our outlook from a fundamental credit perspective remains quite benign at present."
All is well -  until someone isn't "being paid back" ...

SoberLook.com
From our sponsor:

Friday, September 13, 2013

Is mitigation of rate risk worth buying HY loans at sub-5% yield?

Demand for leveraged (sub-investment grade) corporate loans remains strong. Investors are paying a premium for floating rate (LIBOR+spread) paper that is supposed to protect them from rising interest rates.

Fund flows into loan funds (source: GS)

At the same time CLO issuance is expected to spike. CLO managers have been accumulating (warehousing) a great deal of this collateral in preparation for the tranche sales.


This demand is providing price stability in the syndicated loan market, as these products continue to outperform HY bonds.

(ticker symbols: SNLN and HYG) Source: Ycharts

As a result of this demand, yields on leveraged loans have been compressed and pricing is starting to look frothy. It is important to remember these are (on average) single-B type corporate loans. The yields are now sub-5% - near record lows.


While the US corporate sector is in good shape, are investors being paid enough for the credit risk? Default rates are still quite low relative to historical averages, but have risen lately. The trend shown above and the one below look a bit inconsistent.


SoberLook.com
From our sponsor:

Sunday, July 21, 2013

CLO leverage rises to 13x

A new trend has developed in the CLO market. Some of the top managers are now able to place the single-B tranches with investors, thus cutting the size of the equity (unrated) tranche. Since the financial crisis, the lowest rated tranche has been the BB.

Oak Hill CLO (June-2013; source: LCD)
Invesco CLO (July-2013; "L"="LIBOR"; source: LCD)

That extra layer of single-B takes the leverage (total CLO size over the size of the equity tranche) from 9-10x to 13x. Just as a reference below are a couple of transactions from 2012.

Source: JPMorgan

The only way to juice up the projected returns on CLO equity in this low yield environment is to crank up leverage. The leveraged loan market remains quite strong, driven by demand for floating rate paper, low default rates, and lack of M&A activity to bring new supply to the market. As a result, CLO spreads have declined considerably, from L+150 on the AAA tranche in 2012 to L+115 now. The new single-B tranches now price at the spread that the BB tranches used to price in 2012, as investors reach for yield. With this new demand, the 13x leverage becomes possible.


SoberLook.com
From our sponsor:

Friday, July 12, 2013

HY outflows hit record. Outperformance narrowing

An investment in the S&P500-indexed portfolio right before the financial crisis and held through today would certainly outperform an investment into junk bonds, right? Wrong. The chart below shows the returns of two major HY ETFs (blue and orange) and the largest S&P500 ETF (red). Since the end of 2008, junk bonds have consistently outperformed. As one HY trader pointed out "all of you stock pickers were in the wrong asset class".

Total returns (source: Ycharts; click to enlarge)

But now, with interest rates on the rise and fixed income markets out of favor, that gap has been narrowing. Relative to other fixed income products junk bonds have held up quite well - so far (see post). What worries some HY investors is that junk bond pricing is very dependent on fund flows. Equities are also impacted by money moving in and out of ETFs and mutual funds, but not nearly to the same extent as corporate bonds. And the recent trend in HY bond flows is alarming. The outflows hit an annual record recently.

Source: JPMorgan

It remains to be seen when and if equities ultimately catch up to HY bonds. But if these outflows continue, it won't take long.

SoberLook.com
From our sponsor:

Sunday, July 7, 2013

Junk bonds outperforming other fixed income markets

Here are the latest estimates of performance across the various fixed income markets over the past month.

1-month total return (including interest income)

High yield corporate bonds have been the best performer in this near-panic unwind. The reasons include low default rates and strong corporate balance sheets as well as relatively short maturities and relatively high current income (which is included in the performance numbers above).

A great deal of this outperformance recently though has been driven by the strength of the US equity markets. HY spreads tend to have a strong inverse relationship to stock prices.


And with HY spread being a significant component of the overall yield, strong equity markets have kept yield increases relatively modest. If equities come under pressure however, all bets are off for HY.


SoberLook.com
From our sponsor:

Wednesday, May 8, 2013

As lenders look for ways to deploy capital, small businesses benefit

US corporations are enjoying some of the lowest borrowing costs in history. Even the more leveraged (high debt to earnings ratio) large and middle market companies are "fighting off" lenders willing to provide cheap credit. Junk loans now yield 3-5% and spreads are continuing to tighten.

Source: LCD

Existing loans are being "repriced" (converted) into debt with lower rates and looser covenants.
LCD: - Falling new-issue spreads spurred a new round of opportunistic deal flow. In April, issuers cuts spreads on $36.7 billion of institutional loans, up from $24.7 billion in March. In all, issuers have now repriced $155.7 billion of loans, or 28% of the S&P/LSTA Index, by 115 bps on average.
And a great deal of this demand is coming from shadow banking - Business Development Corporations (BDCs), CLOs, and even credit hedge funds (see story). How can US chartered banks (under regulatory pressure) possibly compete when credit for large and mid-market firms is so readily available and so cheap? One way is to expand lending into smaller business space, where sanity still prevails with respect to rates and leverage levels. And that's exactly what banks have been doing. The latest data from the Fed shows banks easing on underwriting standards for small company loans...

Source: FRB ("C&I" stands for commercial & industrial - meaning corporate as opposed to retail loans)

... and tightening spreads.

Source: FRB

While this development is great news for small businesses and the US economy as a whole, it shows that credit may be approaching frothy levels. All this new liquidity from the Fed has to end up somewhere.


SoberLook.com
From our sponsor:

Friday, February 1, 2013

Fears of rising interest rates have investors focused on leveraged loans

Expectations of rising interest rates in the US are creating demand for traded HY corporate loans (also called "leveraged loans" - see discussion). These products typically pay LIBOR plus a fixed spread, which means that the coupon will grow if short-term rates increase. As an example, Invesco’s PowerShares Senior Loan fund (ticker: BKLN), which is supposed to track the price and yield of the S&P/LSTA Leveraged Loan 100 Index, has recently reached $1.5bn in assets. The fund's yield is currently below 5% (keep in mind these are sub-investment-grade companies), making it vulnerable to credit shocks.

BKLN total return (source: Ycharts)

Yet the floating-rate nature of the portfolios keeps investors flooding in, as they become less sure about the timing of the Fed's eventual tightening. In fact, relative to the the market size of each of the asset classes, leveraged loans have seen by far the largest inflows.

Source: Barclays Capital

The demand for this asset class can be seen in the outperformance of loan closed-ended funds. These funds can trade at a premium or a discount to NAV, which can result in out/under-performance vs. the underlying index.

Source: Barclays Capital

With the CLO market booming (CLO's securitize these corporate loans - see discussion), Barclays remains bullish the loan asset class (in spite of the recent rally). There simply isn't enough floating rate product in the market currently to meet this demand.
Barclays Capital: - The insufficient quantity of new loan product has forced investors to continue harvesting the secondary market to avoid accumulating too much cash, as demand technicals continue to be very strong across all major classes of leveraged loan investors. With more than $9bn in new CLOs priced, January was the busiest month for CLO creation since 2007. In addition, loan mutual fund inflows have been robust of late, as investors continue to look for ways to protect against rising interest rates. Cumulative flows for the first four weeks of the year already exceed $3bn. ... Unless rates reverse course and move materially lower, we expect favorable loan flows to continue.


SoberLook.com
From our sponsor:

Tuesday, December 18, 2012

US corporate credit market looking extraordinarily rich

One of the "side effects" of the Fed's monetary expansion is all the capital flowing into spread products, particularly corporate credit. Corporate bond yields are hitting record lows across the ratings spectrum. An average junk bond in the Merrill HY index now yields some 6.3%.

Merrill HY Index effective yield (source: St. Louis Fed)

Even emerging markets corporate HY bond yields are near all-time lows.

Merrill Emerging Markets Corporate HY Index effective yield (source: St. Louis Fed)

In fact credit looks highly overpriced relative to US equities. And equities are not exactly cheap at this stage, particularly given some 2% GDP growth expectations in the US. Goldman's relative value model now shows corporate credit at the richest levels in at least three decades.

Source: GS

SoberLook.com
From our sponsor:

Saturday, November 10, 2012

High yield debt issuance in 2012 hits an all-time record

High yield bond issuance hit an all-time record in 2012, with $306 billion worth of new HY bonds coming to market by the end of October. In fact September was an all-time record month for new issue - on the back of the Fed's latest action.

Source: JPMorgan

Leverage finance space as a whole also hit a new record. Adding  new issue HY bonds and institutional loans (see discussion) puts 2012 ahead of 2007, the previous record.

Source: LCD

Demand for yield remains strong, pushing non-investment grade yields to record lows.

Merrill Lynch HY Bond Index: yield

One of the reasons for this optimism has to do with new issue market pushing out the leveraged finance maturity wall, as companies refinance into longer maturities. Back in 2009 the wall looked quite scary (see this post from 2009), with the largest concentrations of maturities in 2013 and 2014. But the markets have been chipping away at those two years. This reduced the risk of near-term liquidity problems in case the HY new issue market suddenly dries up, lowering expected default rates in the near term.

Source: LCD

We are, however, starting to see some signs of speculative primary market activity. According to JPM, six toggle notes have been issued in October ($2.6bn). These are debt securities that give borrowers the option to skip coupon payments, increasing the face value of the debt instead (payment in kind or PIK). It is roughly the corporate equivalent of option ARM mortgages. Also October saw 11 so-called dividend deals in which the proceeds from a bond sale are used to pay a dividend to the shareholders. This is considered a more risky transaction because rather than using cash to refinance existing debt or acquire a business, the company simply pays it out, causing its leverage to increase. In the mortgage world this is the equivalent of using a home equity loan to take a vacation rather than to put an addition to the house or to repay credit card debt. In spite of some of the more risky transactions, on average the deals have been far less speculative in nature than during the 2006-07 period. This trend of potentially loosening lending standards (such as toggle notes or dividend deals) in the leveraged finance markets will be important to watch going forward.


SoberLook.com

Monday, September 24, 2012

Retail investors jump into syndicated loans

High Yield corporate loans (sometimes also called "institutional", "syndicated", "leveraged", "par", or "bank" loans) continue to be in high demand. And it's not only hedge funds and CLOs (see post) who like this product. Retail investors are piling in as well. Institutional loan mutual funds' assets under management are close to record, as inflows stay high.

Loan funds AUM (source: LCD)

These are loans to sub-investment grade firms such as HCA, Harrah's Entertainment, Reynolds, Avaya, First Data, etc. What makes this product so attractive? Investors like it because the assets pay floating rate (LIBOR plus spread). That means if short-term rates begin to rise, the coupon payments will increase. If inflation picks up for example, most expect these assets to compensate them for the loss in real value (although the risk is that the dovish Fed keeps short-term rates low in spite of inflationary pressures). Also because these loans are senior secured, there is more protection (collateral) than is offered by HY bonds in case of default. And default rates have been relatively low recently.

HY Corporate Loan Default Rates (% per year)

A popular retail product that provides exposure to this asset class is a closed-end fund called Eaton Vance Senior Floating Rate Trust (EFR). The fund is up 21% year-to-date on a total return basis (including dividend).


12/31/2011 = 100

When a fixed income fund has such an outstanding return, it is always important to compare it to the representative index. The S&P/LSTA Loan Index year-to-date return is 8.09%. So how is it that EFR was over 20% with roughly the same type of assets? The outperformance here is not just about picking the right names as would be the case with equity funds. Just as mortgage REITs (discussed here), most of these loan funds run some leverage. The EFR fund prospectus clearly says: "Performance results reflect the effects of leverage resulting from the Fund's issuance of Auction Preferred Shares" (a form of debt). Which means that if the loan index is down, this fund would be down much more.

As spreads stay low and investors reach for yield, demand for leveraged product - even at the retail level - is going to become commonplace in fixed income.


SoberLook.com

Friday, September 14, 2012

Investors fight over "B+" bonds at 5.75%

As an example of how frothy fixed income markets have become, Reynolds did a $3.25 billion HY issuance today. They repaid a great deal of existing debt, but also took half a billion of cash for general purposes - in effect increasing leverage.
Reuters: - Reynolds Group Issuer Inc/LLC/(Lux) S.A. on Friday sold $3.25 billion of senior secured notes in the 144a private placement market, said IFR, a Thomson Reuters service. The size of the deal was increased from an originally planned $1 billion.
And here is the kicker. This is a B1/B+ rated firm ("middle of the road" junk) that just increased leverage. The yield on these 8-year bonds is 5.75%. The bonds are "secured" by some of the Reynolds assets - so if they fail to pay, the lenders can wrap themselves in all the foil they want. The deal was supposedly highly oversubscribed as institutions clamor for yield. Some investors got no or very little allocation of this "hot" issue.

This is not entirely surprising, given the overall HY market yields hitting new record lows. HY is not really "high yield" any longer. This is not going to end well.

JPM Domestic HY Index yield (YTW; Bloomberg)


SoberLook.com

Sunday, August 12, 2012

The CLO market - then and now

After a conversation with Ed Grebeck (Tempus Advisors), I thought it may be helpful to do a quick overview of the evolution of Collateralized Loan Obligations (CLOs) from the "bubble" years to the current environment. The CLO market is the only securitization survivor of the financial crisis that has retained the full capital structure - from "AAA" down to equity (unrated tranche) and has fairly long maturities. The AAA tranches of the pre-crisis years were severely mispriced - paying as low as LIBOR + 23bp in 2007 for example - but came out of the crisis mostly unscathed (except in a couple of fraud cases).

Unlike their brethren in the CDO space that securitized sub-prime resi loans, the CLO collateral - portfolios of non-investment-grade corporate loans - experienced fairly modest default rates. The US corporate sector did reasonably well through the recession and was able to tap the HY bond market to refinance its debt or extend maturities (even for many weak credits). Some companies of course struggled and were too leveraged (like Clear Channel), sometimes undergoing debt restructuring (Tribune, Dynegy, etc.). Some firms, such as TXU - one of the largest LBO transactions to date - are yet to be restructured.

But even more importantly it was the diversification assumptions for the corporate sector that generally worked. Different industries were not impacted equally by the downturn. In the subprime mortgage space on the other hand, diversification was based on geography, a highly flawed approach. The rating agencies applied similar diversification assumptions/logic to California and Florida properties that they would to telecom and energy corporate sectors. The lesson was that corporate diversification, which has been employed by banks for centuries, works reasonably well but can not be translated into residential property markets based on geography.

In spite of its relative success, the CLO market has changed markedly since the pre-crisis era. With no ability to use bank-backed commercial paper (ABCP) to fund the AAA tranches and no monoline (such as Ambac) guarantees, the AAA needed real investors. That means volumes, pricing, and leverage all needed to adjust. Volumes are of course a fraction of the bubble years these days, but are beginning to pick up.

Source: JPMorgan

Leverage has also changed dramatically. The pre-crisis leverage kept increasing through 2007 as the equity tranche became "thinner". 2007 leverage got as high as 15:1 (15x), averaging 12x (assets to equity).

Source: LSTA

That leverage dropped to 7.5x in 2010 as the rating agencies swung to the other extreme, taking the ultra-conservative approach.

Source: LSTA

Leverage has increased somewhat since 2010. One of the deals that printed this month, managed by Symphony Asset Management and structured/distributed by Morgan Stanley, is leveraged just under 10x (417.75M total deal size over 43M equity tranche size = 9.7x).

Source: S&P

Note that the X tranche (78bp) represents Morgan Stanley's fees as well as closing expenses (mostly legal and "warehousing" costs) which the bank financed for Symphony via the "super-senior" tranche. Pricing for the AAA tranche is now around LIBOR+150, making it a bit more interesting for institutional investors like insurance firms. Here are a couple of other recent CLO deal structures - both with leverage under 10x.

Source: JPMorgan

Other changes include permissible collateral. In 2007 CLOs permitted the inclusion of 5-10% of unsecured HY bonds and 5-7.5% of tranches of other CLOs. Up to 10% of second lien (as opposed to standard first lien) loans could also be included. Current CLOs generally do not allow any of this. Maybe a couple percent could be in bonds, but they would all have to be senior secured.

Legal maturities went from 12-14 years in 2007 to about 10 years these days. Perhaps the biggest change has to do with the "reinvestment period" - the period during which the manager is permitted to replace loans that prepay (partially or fully). It went from 6-7 years in 2007 to 2 years these days. Investors want the manager to build a portfolio and after a couple of years let the deal begin amortizing. That makes the AAA durations considerably shorter, reducing mark-to-market volatility.

CLO managers continue to be plagued by difficult markets. Low volumes of new institutional loans make it harder to ramp collateral quickly (a sufficient amount of collateral has to be invested in order to close the deal). At the same time banks do not finance loan "warehousing" for too long in fear of getting stuck with the collateral if the market shuts down and the deal does not close - which happened in 2008. Equity returns are considerably lower (because of lower leverage) than they used to be, ranging from 10% to 15% (vs. in the 20s during the pre-crisis era). New regulations pertaining to bank capital and risk retention rules will put a damper on how much the banks will be able to structure and distribute. And of course Europe could quickly bring this market to a grinding halt. Nevertheless as demand for fixed income stays strong (these days investors are chasing anything with a coupon), CLO managers are cautiously optimistic.


SoberLook.com
Related Posts Plugin for WordPress, Blogger...
Bookmark this post:
Share on StockTwits
Scoop.it