Showing posts with label fixed income. Show all posts

Wednesday, June 25, 2014

Fixed income risk appetite headed for euphoria

The global appetite for fixed income remains strong, driven by ongoing accommodation from central banks. The 10-year Bund yield touched fresh lows for the year today. The situation is similar for shorter maturities.

Source: Investing.com

This yield compression is not limited to bonds. As an example, Asian commercial property yields are at new lows as well. For those who want some background on the meaning of "property yield", here is a good overview.

Source: WSJ

The Credit Suisse Duration Risk Appetite Index is once again headed for euphoria after being in panic territory just a year ago.


The index measures investors' appreciate for being long fixed income product - as they shift from taper fears last summer to frenzied buying today. The longer the current environment persists, the more difficult it will be for central banks to begin rate normalization.

________________________________________________________________________________


SoberLook.com
Sign up for our daily newsletter called the Daily Shot. It's a quick graphical summary of topics covered here and on Twitter (see overview). Emails are distributed via Freelists.org and are NEVER sold or otherwise shared with anyone.


From our sponsor:

Saturday, August 17, 2013

Year-to-date performance across fixed income

Given the ongoing volatility in fixed income markets, it's time to once again to take a look at performance. The chart below shows where we stand on a year-to-date basis for major asset classes from a USD investor's point of view.

Note: returns vary based on specific indices used

No real surprises here, as the only positive return comes from senior corporate loans. Most of the outperformance is the result of these loans paying a floating rate coupon (LIBOR + spread), which is expected to rise with rates. Corporate debt has also benefited from the stock market rally, tight spreads, and relatively low default rates.


SoberLook.com
From our sponsor:

Sunday, July 21, 2013

Diverging fund flows are reflected in fixed income performance

Capital is returning to certain fixed income sectors. Fund flows are quite uneven however, with the corporate sector remaining investors' favorite. In particular, high yield bonds have recouped a great deal of the recent outflows.

Source: Goldman Sachs

In contrast, mumi bonds have seen almost no new net inflows. The little problem in Detroit is not helping the situation (see story) and the SEC going after the city of Miami (see story) has made the sector look quite unappealing.

Source: Goldman Sachs

Outside of treasuries, fixed income performance these days is extremely sensitive to fund flows. And the returns over the past month (June 20th - July 19th) fully reflect these dynamics in mutual funds and ETFs.


SoberLook.com
From our sponsor:

Tuesday, July 9, 2013

Retail fixed income investor capitulation

Spooked retail investors are exhibiting complete capitulation in their bond portfolios. They have been dumping fixed income assets, particularly munis, in record amounts.

Source: DB

And the proceeds are ending up in money market funds - while institutions are reducing their overall money market funds holdings.

$mm (source ICI)

Are US retail investors overreacting to "taper" talk? For those who like to take contrarian bets, this looks like an opportunity.


SoberLook.com
From our sponsor:

Sunday, June 23, 2013

From rotation to panic - a turning point?

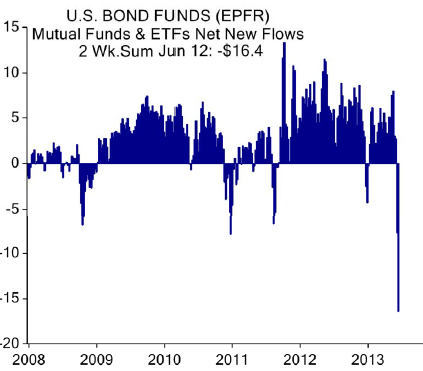
The latest report from the ISI Group called the recent outflows from bond funds "a bit of a panic". Indeed after years of growth, the drop in fixed income funds' AUM is nothing short of spectacular.

Source: ISI Group

Some insist that this is more of a "rotation" than a panic. A possible way to settle the argument is by looking at the Credit Suisse Risk Appetite Index. One of its components is the Fixed Income Risk Appetite sub-index, which in fact just entered the "panic" mode for the first time since 2011.

Source: Credit Suisse

However, those who prefer the contrarian view of the markets will appreciate the following quote.
Credit Suisse: - A break into "panic" territory has historically been a strong signal for a turning point in the bond market, indicating that the market has become very oversold in the short run. Since the start of the index in 1995, there have been seven such signals. Six out of seven times that translated into longer-dated US bonds outperforming bills over a period of 3-6 months. In recent years, panic deeps have on average become shorter and shallower, resulting in even stronger signals.
The fundamental explanation here is that a sudden rate shock we've had can't be great for the economy. And any visible sign of renewed US economic weakness could delay the Fed's "taper", creating a bid for bonds.

SoberLook.com
From our sponsor:

Friday, June 21, 2013

Fixed income party is over - for now

This has been one of the worst months for fixed income assets in years. Active investors are dumping bonds of all types. Here is what the performance looks like over a period of a month (through today).


A great deal of this selling has been forced by ETFs. Lower valuations force the exchange of shares for the underlying securities, which are then sold into the market. Mutual funds are losing capital as well. Firms like BlackRock (BLK) have had an amazing run in recent years (see discussion), but the party is over. BLK is down 11.5% over the past month.

SoberLook.com
From our sponsor:

Saturday, June 15, 2013

Rotation out of fixed income

Last year we discussed just how frothy the US fixed income valuations have become (here and here). Now in a matter of several weeks, the US bond markets have wiped out a year's worth of gains and then some. That includes all the interest income.


In fact, according to JPMorgan, May saw the worst global bond performance since early 2004.

Source: JPMorgan

All of a sudden the realization has set in that rates may in fact rise and the multi-year bond rally may at some point come to an end. Google Trends shows a spike in searches related to rates rising.

Google search frequency for rates rising

Not surprisingly bond fund and ETF outflows spiked, as investors began abandoning the beloved fixed income funds in droves.

Source: ISI Group

In the next post we will discuss the so-called "Great Rotation", which predicts that these outflows should end up in the equity markets.


SoberLook.com
From our sponsor:

Tuesday, October 30, 2012

US fixed income markets on a single chart

Here is what chasing yield looks like in the current environment. The horizontal axis indicates the size of each US fixed income market (in $trillion). The vertical axis shows the yield adjusted for historical losses due to defaults (more on that later). The Agency MBS adjustment takes out the prepayment option (OAS).

The Fed is achieving its goal - investors are shifting to the left.

Source: Goldman (click to enlarge)


SoberLook.com

Monday, August 27, 2012

Has "worship of stocks" turned into "reverence for bonds"?

The trend started in early 2009. Net flows into fixed income mutual funds began to rise, while equity funds stayed flat. The trend continues through today, although equity ETFs have fared better than mutual funds (see discussion). But even within the ETF universe, flows into fixed income accelerated while equity ETFs grew quite gradually if at all.

Shares outstanding for SPY (S&P500 ETF)  vs LQD (investment grade bond ETF) (Bloomberg).

Given that the corporate bond market is smaller and less liquid than the equity market, that imbalance in growth of cumulative flows has driven yields/spreads to historical lows. Now some analysts are asking if corporate credit is overpriced relative to equities. One way to assess this is by looking at corporate bond yields vs. equity dividend yields.

The spread between the two has collapsed recently. One gets almost the same income holding corporate bonds as buying the S&P500 stocks. Is this the "new normal" according to PIMCO? Has the "worship of stocks" turned into the "reverence for bonds" (which is of course what Bill Gross wants)? Or are we simply looking at a market dislocation?

Source: CS


SoberLook.com

Sunday, July 8, 2012

Year to date fixed income asset class performance vs. volatility

We are half way through the year and it's time to take a look at how the various fixed income asset classes have performed year to date. But as institutional investors tend to do, let's look at the performance as a function of volatility. Here is the chart, with the S&P500 and the hedge fund index thrown in for good measure.


The winners on a risk adjusted basis are preferred equities, emerging market bonds, and investment grade corporate bonds. Long term treasuries did well in terms of return but ended up being highly volatile (with this volatility likely to continue).

SoberLook.com

Tuesday, April 24, 2012

A look inside life insurance companies' portfolios


JPMorgan recently performed a study on the composition of portfolios managed by life insurance companies. The study looked at the top 20 life insurance firms using their regulatory filings. These are the portfolios set up to support projected policy claims. The reason it is important to measure the composition and the changes in such portfolios is that life insurance firms manage $1.9 trillion in assets. Here is the current breakdown.

Source: JPMorgan

What stands out is that a third of the allocation is to corporate credit. That bucket includes both IG and HY, with a rating of A and higher making up nearly half of the allocation. BBB bonds make up 43% of the corporate credit allocation, leaving about 8% for HY.

The next chart shows dollar changes across the allocations over the past one year and also six years. It demonstrates how life insurance firms have provided the bid for investment grade corporate credit. There has been a substantial reduction however to bonds of financial firms. The other major declines have been in structured credit and equities (aging population forces these firms to reduce riskier assets as disused earlier). Structured credit has included a rebalancing toward ABS (pooled credit cards, auto loans, etc.), which are short maturity and have performed well.

USD billion

On a percentage basis we see a large increase in treasuries and agencies as well as munis. JPMorgan attributes this to the fact that there is a limited supply of high quality spread product: "there is a shortage of spread Fixed Income product which is contributing to the growth in Treasury holdings."

Source: JPMorgan

Going forward it will be increasingly difficult for life insurance firms to meet their portfolio growth requirements as spreads and yields are now near historical lows. That will translate into reduced earnings for these firms as more of the premium would need to be put away to meet policy claims.


SoberLook.com

Monday, April 9, 2012

Remembering fixed income asset classes at a cocktail party

Guest post by TheDealer


One day you find yourself at a fairly boring cocktail party in town. You've had a couple of drinks and just as you are about to sneak out of there, a gentleman with a bushy mustache you've met earlier (and for the life of you, can't remember his name) approaches. "So Sarah", he says. "I hear you are in finance." You know what's coming now; he's going to be looking for some stock tips. Will just tell him "AAPL" - maybe he'll go away. But to your astonishment he asks a strange question. "Sarah, which fixed income asset class has had the best returns over the last couple of years?" All of a sudden you notice a bunch of other people staring your way, fascinated by this unusual question. But you know the answer because you've analyzed your fixed income ETFs.

Fixed income asset class returns over the past two years as measured by the corresponding ETFs  (in parenthesis)

Your answer is "Long term treasuries of course. A 35% return over the past couple of years." Now more people at the party are listening. "Yeah," you tell them. "Equities only did 23%, under-performing treasuries". The gentleman with the mustache takes another drink, and after staring at you for a while asks another strange question. "So Sarah, since you know so much about fixed income, tell me which asset class has been the most volatile in the last couple of years?" Now you start thinking back to your ETFs and you want to say High Yield bonds. But then you remember the pain you took on the TLO short roller coaster after Bill Gross "suggested" it.

Fixed income asset class annualized daily volatility over the past two years

And it comes to you: "Also long term treasuries. The most volatile fixed income asset class in the past two years." The people standing around you are quite surprised. Someone says "How can the be?". But you remember your volatility chart and answer - "That's right, long term treasuries experienced over 15% annualized volatility. The next most volatile asset class was convertible bonds - only because these bonds have an equity-like component"

Now more people from the party have surrounded you to learn all they can about fixed income (they must all be Baby Boomers thinking about retirement). And you figured you look like a hero having recalled all this cocktail trivia. And just as you get ready to triumphantly exit, the mustached man, having clearly had one too many, asks in a loud voice: "Hold on there Sarah. One last question".

Now you have a decision to make. You walk out and feel pretty good about your knowledge of fixed income or you stay and answer one last strange question, risking being embarrassed. But you stay because this has become a challenge. "OK Sarah, here goes," he says. "Which fixed income asset class has had the best performance on a risk adjusted basis in the last couple of years?". You think to yourself - this guy has lost his marbles. But now you can't just walk away - too many people at the party want to hear your answer.

So you try to do some quick arithmetic in your head dividing the returns by the volatility numbers (the poor man's Sharpe ratio). You keep getting an answer that doesn't seem very intuitive - long-term treasury returns on a risk adjusted basis actually weren't that great. A few other asset classes come to mind that did  considerably better. You give the a short answer: "Mortgage bonds and corporate bonds outperformed treasuries on a risk adjusted basis". People are now duly impressed.

Two year returns over the annualized volatility (rough ranking of risk adjusted returns)
You leave the party, redo the math, and satisfy yourself that you knew the answers (except for the fact that intermediate treasuries also did quite well on a risk adjusted basis). But now you know you are absolutely ready for the next cocktail party - no matter how strange the questions are (or the people for that matter).


SoberLook.com

Sunday, March 25, 2012

The great asset class rebalancing

Here is the latest data from DB on fund flows for the major asset classes:

Equity mutual funds are continuing to lose ground to ETFs. The US domestic equity mutual funds have lost some $100bn since Jan of 2009, while equity ETFs are up around $50bn during this period.

Source: Deutsche Bank

But the equity asset class as a whole is losing AUM. Some of this capital is of course flowing into fixed income funds. Investment grade corporate bond mutual funds and ETFs have gained $131bn ($42bn into ETFs and $89bn into mutual funds) for the same period, while HY funds picked up $48bn ($20bn into ETFs and $28bn into mutual funds). Given the demographic changes in the US that favor fixed income as well as the loss of confidence in equity mutual funds, this trend is expected to continue.

SoberLook.com

Tuesday, January 17, 2012

New fund flows and limited supply provide support to the muni market

The municipal bond (muni) market in the US has been on fire lately. Seems investors have discounted Meredith Whitney's famous dire forecast.
SFGate: Investors in the $3.7 trillion U.S. municipal-bond market are buying long-term debt at the fastest pace since the eve of Meredith Whitney's 2010 prediction of "hundreds of billions of dollars" of public-borrower defaults.
As the chart below from JPMorgan shows, the flows into muni funds represent at least a partial reversal of what was occurring in this market the same time last year.

Muni fund flows (source:JPMorgan)

The market has responded strongly to these inflows with the S&P Municipal Bond Index outperforming treasuries by nearly 2% during the past month.

S&P Muni Index vs. the iBoxx US treasury index (Bloomberg)
Furthermore it looks like the supply of new bonds is not expected to increase substantially. JPMorgan forecasts $350 billion of issuance in 2012 or 20% above what we saw in 2011. That seems like a bunch of new supply, but much of it represents refinancing of existing bonds. A number of municipalities are projected to be taking advantage of lower rates and calling their existing debt. In fact as the chart below shows, the net new supply of munis for 2012 is expected to stay close to flat (the negative numbers on the chart indicate a net reduction - more bonds being called than issued).

Net new supply of municipal bonds - 2012 forecast vs. 5-year average (source: JPMorgan)
Clearly risks to the downside remain.  A disruption in global credit markets could quickly widen municipal bond spreads.  A less likely scenario is a sharp steepening of the US treasury curve that may hurt the longer term munis.  These risks aside however, the limited supply and low rates should provide sufficient support to the muni market, as flows into fixed income funds continue


SoberLook.com

Friday, December 30, 2011

Zero rates and risk aversion drove mutual fund flows

The trend of preference for fixed income mutual funds over equity funds that started in 2009 continues today. Recent data from Credit Suisse shows clear risk aversion with taxable bond fund flows beating out equities by a substantial amount.

Source: Credit Suisse

What about non-taxable bond funds?  For a while there it was rough going with Meredith Whitney hyping up the doomsday scenario for munis.  Fund outflows in late 2010 spiked, but as investors started to realize that default rates are not going to be nearly as extreme as predicted, investors started coming back, attracted by great after-tax returns.

Source: Credit Suisse

In the equity mutual fund space the period of 2009-2010 saw many investors betting on foreign equities (see chart below), particularly emerging markets.  By the second half of 2011 that bet wasn't working out for them and fund outflows picked up from both domestic and the foreign funds.


Source: Credit Suisse

Some have attributed the equity mutual fund outflows to recent preferences for ETFs because of the ability to trade those intraday. That is indeed the case as equity ETFs have taken market share from mutual funds, though not enough to offset the overall decline.

Source: Credit Suisse
But some of this ETF flow increase has been driven by institutional investors as hedge funds and even endowments got a taste for the liquidity of ETFs. Retail investors on average continue to shy away from equities.

These trends are likely to continue into 2012 as the combination of stresses in the eurozone and zero short-term rates will combine risk aversion with search for yield to favor bond mutual funds over equities.

SoberLook.com

Wednesday, December 7, 2011

Hedge funds struggle in 2011

Hedge fund performance this year continues to be poor. The overall Credit Suisse hedge fund index is down about 7% year-to-date, though off the September lows. The best performing component of the index is "Fixed Income Arbitrage", which is down 1%. Global Macro strategies are down 10% on average as people continue to get whipsawed in currency, commodity, and rates markets that have seen multiple and violent trend reversals.

Source: Dow Jones/Credit Suisse


The worst performer is the "Event Driven" group, down 12%. A number of these funds invest in distressed assets. Some try to hedge their portfolios with liquid indices. This year some got hurt on the core assets (as a number of distressed names deteriorated sharply) AND on the hedges as well.

Source: Dow Jones/Credit Suisse
SoberLook.com
Related Posts Plugin for WordPress, Blogger...
Bookmark this post:
Share on StockTwits
Scoop.it