Sunday, September 9, 2012

The UK's poor labor productivity may be signaling more layoffs

The UK economy is in a "double dip" recession, with the longest recovery in recent history - and still nowhere close to the pre-recession GDP. The nation was impacted by the US financial crisis as hard as it was hit by the Eurozone contraction.

Source: DB

Somewhat surprisingly however, the UK's overall workforce rebounded this year.

UK Employment Workforce Jobs By Industry All Jobs
(unit = 1000, Bloomberg)

More workers and low GDP means that the output per worker (productivity) has worsened dramatically.
DB: - ... output per person or per hour worked – has been exceptionally weak in this recession. In fact, depending on exactly how we measure it, UK workers are 2-3% less productive than before the crisis five years ago. In the absence of a crisis, we would have expected to be well over 10% more productive than five years ago. In terms of the sectors that have been responsible for this weakness, it has been services rather than manufacturing, but also the extraction sector (North Sea oil/gas extraction and production) where we’ve seen productivity slide the most.
DB proposes multiple explanations for the UK's relatively poor productivity, including declining wages (that allow companies to keep more workers), public jobs, and fewer bankruptcies than in previous recessions. None seem to provide the full answer. A more troubling explanation however is that the UK unemployment is simply lagging the GDP decline and we will see more layoffs going forward. The reduction in the number of employees in turn will improve labor productivity as it did in the US where companies were quick to let employees go.


SoberLook.com

Key Eurozone CDS spreads hit 2012 lows

The Eurozone sovereign credit markets saw unprecedented declines in key CDS spreads last week. The spreads are now below the levels reached after the 3y LTRO programs were put in place.

Source: JPMorgan

It seems that a number of hedge funds were long sovereign debt protection (short the credits) and have finally capitulated last week. As discussed, Draghi has accomplished his goal of punishing the shorts in the market. But once again, caution is needed here as we enter a potentially volatile week with most of the the "good news" already priced in.
Reuters: - German judges, Dutch voters, IMF inspectors and Brussels regulators could all spring surprises that make it harder to resolve a sovereign debt crisis which is almost three years old and weighing on the world economy.


SoberLook.com

Economists have underestimated the severity of structural shift in US employment dynamics

Continuing on the topic of the US labor markets, it's worth taking another look at the concept called the Beveridge curve. Per Wikipedia "a Beveridge curve is a graphical representation of the relationship between unemployment and the job vacancy rate (the number of unfilled jobs expressed as a proportion of the labor force)". In the previous post on this topic we discussed the structural shift in the US employment dynamics that took place since the Great Recession. Unfortunately the analysis performed by Barclays (as well as most economists, including the Fed) compares job openings ratio to the official unemployment rate. But we know that this rate is not a good measure of the true state of unemployment in the US because it does not include those who have stopped seeking employment altogether.

A more relevant measure of US unemployment dynamics is the so-called "Employment Population Ratio" (not to be confused with labor force participation rate). It is defined as (per Wikipedia) "a statistical ratio that measures the proportion of the country's working-age population that is employed" (see discussion). The chart below compares the two measures, showing a clear divergence as fewer people who are out of work are counted in the official unemployment statistics.

Source: U.S. Bureau of Labor Statistics

Now we plot the Beveridge curve using the Bureau of Labor Statistics Employment Population Ratio on the x-axis (reverse order) and the JOLT Job Openings Ratio (% of jobs not filled as percentage of all jobs) on the y-axis. This tells us how the labor market in the US responds to job openings. In a healthy job market one wants to see increasing employment-population ratio as more jobs become available - which was the case prior to the Great Recession.

Modified Beveridge Curve
Source: U.S. Bureau of Labor Statistics

As the chart above shows, not only has the curve shifted since the recession, but the slope rose dramatically as well - something that is not visible in the traditional Beveridge curve. In the post-recession environment, the employment-population ratio is no longer responsive to increases in job openings. This is a severe structural shift driven by a spike in the length of unemployment (see further discussion). People don't have the skills, the mobility, or the will to fill those job openings. The problem is significantly worse than what economists have been estimating by using the official unemployment rate.

Which takes us back to the issue of monetary expansion. Even if the Fed somehow manages to increase the number of job openings (a highly unlikely outcome in this environment), the structural shift that has occurred makes it unrealistic to expect the overall employment picture improving.


SoberLook.com

Labor participation for men in the US hit the lowest level on record; decline among younger men is particularly sharp

Friday's employment figures were terrible across the board, although some have naively interpreted the decline in the headline unemployment rate (from 8.3% to 8.1%) as positive news. Unfortunately there is nothing positive about this change. As before, the decline is simply an indication of people dropping out of the labor force. This is clearly visible in the labor force participation rate (discussed earlier this year), which has now declined to the lowest level in over 3 decades. In fact the only reason that labor participation in the late 70s was lower than today is that women were still in the process of entering the workforce. Labor force participation among men is now at the lowest level on record - going back to 1948. This includes men with a college education.

What's particularly troubling is the relatively recent sharp drop off in the participation ratio for younger men (between the ages of 20 and 24), which is also at the lowest level on record (chart below).

US labor participation rate ages 20-24 SA (Bloomberg)

Once again, this is a structural issue that can not be remedied with monetary policy.


SoberLook.com

Saturday, September 8, 2012

The anticipation of aggressive monetary expansion by the Fed woke up inflation expectations

Friday's poor employment report has given us a good window into how financial markets react to prospects of a monetary expansion. The weakness in the US labor conditions has significantly increased the probability that the FOMC will lean toward an outright asset purchase program. Friday's market reaction to this possible move by the Fed is shown in the table below.


Typically weak labor markets are an indication of decreased demand and should not result in price increases in industrial commodities or energy. Yet Friday's moves in copper and oil are clearly the result of QE expectations (see this discussion). Some analysts continue to argue that Friday's gasoline price increase is due to the Hurricane Isaac hampering the refining capacity in Louisiana. That is a difficult argument to make in the face of the CRB commodity index as a whole rising 90bp for the day.

In a classic response to a potential monetary expansion, the dollar had a sharp decline of nearly a percent (see this discussion). And as expected treasuries rallied after the jobs report increased the probability of the Fed's incremental buying. But later in the day a more troubling trend was established. The treasury curve steepened, with the 30y bond and other longer dated treasuries steadily selling off for the rest of the day.

Source: Bloomberg

Steepening Treasury Curve
Treasury yield changes Friday, 9/7/2012 (Source: Bloomberg)

Why did the treasury curve steepen in spite of clear expectations of the Fed's new securities buying program? The answer has to do with market participants beginning to price in materially higher longer term inflation. While shorter term inflation expectations remain relatively benign (though rising), the 10-year expectation for example (derived from inflation linked treasury prices) rose to 2.37% on Friday (chart below). The same expectations of elevated inflation in the future also drove up the price of gold.

10y inflation expectation intraday (10y "breakeven"; Bloomberg)

Rising long term inflation expectations intraday had pushed real yields for longer dated treasuries deeper into negative territory (see this post), forcing a selloff in the 30y bond, even as the shorter dated treasuries were up on the day. In fact the 10-year inflation expectation (and gold price) has been on the rise (chart below) since the market began anticipating additional easing from the Fed and the ECB.

10y inflation expectation (10y "breakeven"; Bloomberg)

An aggressive monetary easing program at this juncture could be a dangerous move for the FOMC. Structural changes in the US labor market since the Great Recession make the Fed's quest to materially bring down the unemployment rate rather fruitless (see discussion). And as an "unintended consequence", the central bank could boost inflation expectations - particularly the headline number that includes food and energy. With the US consumer sentiment already shaken (see this discussion), it wouldn't take much for spending to begin declining. Gasoline and food prices may not be a major part of the overall consumer spending in the US, but rapid increases can play an important psychological role in inhibiting spending, thus negating the very reason for the expansionary policy.


SoberLook.com

Friday, September 7, 2012

Economic Surprise Index has turned positive

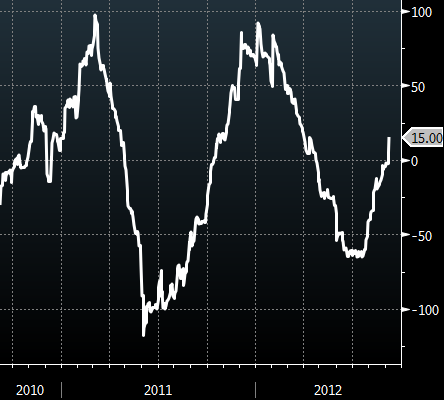
The Citi Economic Surprise index was fairly accurate in pointing to a US slowdown in the first half of 2012. One therefore should not dismiss the recent reversal in the indicator's trend. The index just went into the positive territory in spite of today's poor employment report.
Washington Post: - While today’s jobs data trailed forecasts, better-than- projected reports over the past three months have pushed the Citigroup Economic Surprise Index for the U.S. to an almost five-month high. The index, which measures how much data is beating or missing the median estimates in Bloomberg surveys, climbed to 15 today after yesterday rising above zero for the first time since April.
Citigroup Economic Surprise Index - United States (Bloomberg)

The contributors to the recent uptick include positive surprises from ISM Non-manufacturing Composite, Initial Jobless Claims, US Factory Orders, various housing indices (15% YoY in pending home sales for example), chain store sales, and auto sales. Growth in the US is clearly subpar, but the economy is not headed for a "double-dip" as many had predicted. People also need to come to terms that slow growth, driven by weak global demand, is the "new normal".


SoberLook.com

Equity trading volumes in the US continue to shrink

As as sign of sharply declining share trading volumes in the US, the broad measure of exchange volume computed by Bloomberg (below) is at a level not seen since 2008.

US total exchange volume 180-day moving average (MM shares; source: Bloomberg)
Tape A, B, C on all US exchanges (exchange symbol US) plus OTC (exchange symbol UV) and OTCBB (exchange symbol UU) trading volume for all security types.

There is a great deal of debate about the reason for this trend and what it means for the market in general. One of the common explanations has been the fact that market volatility has declined recently, bringing trading volumes down with it.
WSJ: - Thankfully for many people, volatility is rather benign these days, which could explain why volumes as well are quieter.
The chart below shows S&P500 historical volatility (180-day moving window). Recent period volatility is indeed low, but it's by no means the lowest in the past 10 years. The relationship between volumes and volatility is not at all obvious.

S&P500 180d historical volatility (Bloomberg)

Another explanation is that retail investors, burned by a series of market shocks, are simply staying away.
USA Today: - Part of the reason volume is low is because retail investors have been turned off by stocks, says Ryan Detrick of Schaeffer's Investment Research.
Some view the retail investor staying out as a bullish sign. In the past retail involvement has been a fairly reliable contrarian indicator.
Credit Suisse (via Business Insider): - "We stay overweight of equities and raise our year-end S&P 500 target to 1,500 from 1,425 - introducing a mid-2013 target of 1,520," he writes. "We think weak volumes imply a high chance of a sharp move in markets - it could be up!"
But there are a couple of problems with viewing low trading volumes as a bullish sign. One is that the retail investor exit may be more of a structural change that is here to stay. Retail investors continue exiting equity mutual funds for example, in part replacing them with index ETFs (see discussion). This year alone, some net $68bn left equity mutual funds. That means betting on retail investors piling in all of a sudden - as they have done in the past - may not be prudent in this environment.

The other reason the contrarian bet may be premature is that some institutional participants such as hedge funds have also been less active in the market. The latest ISI Group Survey of hedge funds shows them to be on average underinvested (long or short). It's not all retail driven.

Whatever the case, declining volumes will be important to watch going forward. As the Volcker rule pushes dealers to cut inventories further, poor liquidity in some shares may quickly become a serious problem.


SoberLook.com

Thursday, September 6, 2012

Iran may be successfully smuggling oil, avoiding customs

Iran's oil output hit a new low recently as sanctions, particularly those from the EU took hold. The chart below points to an unprecedented collapse in production. And it is estimated that Iran's oil exports are now down some 66% YoY.

Iran's crude oil production (Bloomberg/OPEC; unit = 1000 barrels/day)

But are the official export numbers right or is Iran finding ways to get around the sanctions? According to Bloomberg, Iran's tanker fleet is now on the move. Since February Iran's tankers have been used for storage of excess oil that could not be sold into the market because of the sanctions. These ships were kept stationary. But now Iranian crude carriers seem to be on the move.
Bloomberg: - Iran’s tanker fleet is the busiest since February as fewer vessels store unsold oil at sea and more switch to transporting cargoes that most crude carriers are barred from hauling, said EA Gibson Shipbrokers Ltd.

The number of very large crude carriers operated by Tehran- based NITC in use for floating storage fell to 10 by the end of August, Steve Christy, director at London-based Gibson, said by phone today. That was a six-month low, he said.

More of these ships are being used to move crude sales into the international market, rather than to store unsold cargoes in the Middle East region, which is what was happening in 2010,” Christy said.
This seems to indicate that in spite of the official export numbers hitting new lows, Iran may be successfully bypassing customs registration and smuggling crude to some buyers - likely at a discount to the market. Of course Iranian authorities and companies would never admit to the part about the discount. The smuggling part however is another story. Iran has recently all but admitted to smuggling, and may now be in fact using this "export" capability as a propaganda tool.
Tehran Times: - ... Oil Minister Rostam Qasemi said that although the West has imposed sanctions on Iran’s oil sector with the goal of toppling the Islamic establishment, the country’s oil exports will never be halted because oil consuming countries need Iranian crude.

There are many ways to easily sell oil, one of which is to take advantage of businessmen and the private sector,” Qasemi added.

SoberLook.com
Related Posts Plugin for WordPress, Blogger...
Bookmark this post:
Share on StockTwits
Scoop.it