Showing posts with label HY bonds. Show all posts

Friday, June 6, 2014

Worsening risk/reward fundamentals in US corporate credit

US corporate credit markets, particularly high yield bonds, are becoming quite frothy, as risk/reward dynamics continue to worsen. Here are some key indicators:

1. In the last couple of years high yield supply has been massive relative to equities. HY has had no shortage of buyers thus far, but the market is becoming increasingly comfortable with the primary market buyers always being there. Investors are ignoring the fact that such demand may not always be the there.

Source: Barclays Research

2. High yield bond spreads have declined to new post-recession lows, with the latest spread tightening driven by yesterday's ECB's easing. Bond holders are simply not being compensated for the risk they take.


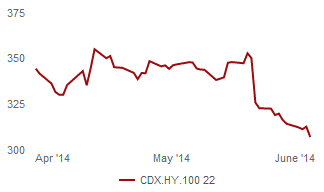
3. Similarly, corporate credit default swap spreads are falling as well. Here is what CDX (index of CDS) spreads have done recently for both investment grade and HY indices.

Investment grade CDX spread; current on-the-run series (source: Barclays Research)

High yield CDX spread; current on-the-run series (source: Barclays Research)

4. Valuations in the most leveraged and lower quality portion of the credit spectrum have risen dramatically. Over 60% of corporate bonds rated CCC by Fitch now trade above par.

Source: Fitch Ratings

To be sure, improving economic fundamentals in the US have reduced default risks considerably. But we are now back to the days when the ability to refinance is taken for granted and current cash flow to service debt is starting to become less relevant. With banks' ability to hold inventory impaired, these markets are becoming quite vulnerable to a sharp correction.

___________________________________________________________________________
SoberLook.com
Sign up for our daily newsletter called the Daily Shot. It's a quick graphical summary of topics covered here and on Twitter (see overview). Emails are distributed via Freelists.org and are NEVER sold or otherwise shared with anyone.


From our sponsor:

Wednesday, January 29, 2014

HY bond market weathering the storm

The US corporate high yield market remains incredibly resilient in the face of increasing global volatility. Year to date the broad HY index has outperformed the S&P500 by over 4.25%.

SPY = SPDR S&P 500 ETF; JNK = SPDR Barclays High Yield Bond ETF (source: Ycharts)

One reason for this stability is the strong performance of the treasury market this month. Also many investors have become quite comfortable (perhaps too comfortable) with junk debt. Part of the reason is the low default rates recently as well as vibrant primary markets that have been willing to refinance (roll) maturing debt. In addition, supply of new bonds has been relatively light, while fund inflows remain robust (see story). As a result HY spreads are less than 10bp higher than they were at the end of last year.

Experienced analysis and investors in this space openly admit that it's just a "matter of time" before this market "cracks". It simply needs a catalyst, such as a large unexpected corporate default. Maybe a major event in the sovereign bond market could dislodge HY. Short of that, junk bonds could remain at frothy valuations for some time. 


From our sponsor:

Wednesday, December 25, 2013

US credit risk appetite hits euphoria

Per earlier post (see discussion and chart), corporate spreads in the US are grinding lower - with new post-recession lows for both IG and HY spreads. The Merrill HY Index spread is now below 400bp and the investment grade equivalent is below 130bp. For those who track fixed income ETFs, the following chart comparing treasuries with corporate bonds (LQD vs. IEF and HYG vs. IEI) illustrates the extend of spread compression.


In fact US corporate credit is outperforming other forms of credit assets such as commercial real estate (see post). A good way to see that outperformance vs. global risk assets is in the components of the Credit Suisse Risk Appetite Index. For the first time since Bernanke began hinting about taper, US Credit Risk Appetite is at the level of "euphoria".

Source: Credit Suisse

But some argue that these credit spread levels are justified given where the US stock market is currently valued. The scatter plot below shows the S&P500 index vs the HY index spread over the past 10 years. The last time spreads were at these levels (2007), equities were priced much lower (S&P500 was around 1550). Of course corporate revenue has grown substantially since then making this comparison less relevant. Nevertheless some are suggesting that it's the stock market which is overvalued relative to credit.


Whatever the case, as monetary conditions in the US begin to tighten and interest rates rise, credit spread compression has to slow or reverse. The current trend is simply not sustainable.


SoberLook.com
From our sponsor:

Friday, December 6, 2013

US corporate spreads lowest in 6 years

While everyone talks about the "great rotation" from bonds to equities, we've had a different type of rotation taking place within the US fixed income universe - the rotation from treasuries into credit. Here is a simple comparison of total returns between high yield and treasury bonds over the past few months. Corporate credit outperformance has been remarkable.


The result of this "rotation" has been the collapse in corporate spreads, which has been persistent across the credit spectrum. Both investment and non-investment grade bond spreads have not been this tight since the bubble years.


Of course as corporate spreads come in, there is increasingly less cushion to compensate investors for the losses due to rising yields. And yields are likely to rise in 2014. There is no question that at least within corporate credit we are moving into "bubble" territory.
BW: - Spreads on U.S. investment-grade and junk bonds have contracted by almost 700 basis points from a peak of 896 in December 2008, about three months after the collapse of Lehman Brothers Holdings Inc. helped spark a seizure in credit markets, Bank of America Merrill Lynch index data show.

After average annual returns of 10.8 percent since the end of 2008, investors have been left with spreads that are 8 basis points below the average 208 basis points during the 10 years ended 2007, the index data show. That may leave investors with too thin of a cushion against losses should benchmark interest rates climb.


SoberLook.com
From our sponsor:

Thursday, October 3, 2013

HY spreads now positively correlated to treasury yields

Here is further evidence that in this environment treasuries are driving "risk asset" valuations. Corporate HY bond spreads are now positively correlated to treasury yields. That's quite unusual because traditionally when treasury yields shrink, spreads rise (negative correlation).

Based on Merrill HY Index

By not allowing treasury yields to rise, the Fed is artificially suppressing HY spreads (as well as other "risky" bond spreads). The corporate market is therefore heavily dependent on stimulus, making any attempt to normalize monetary policy increasingly difficult.


SoberLook.com
From our sponsor:

Saturday, August 3, 2013

Six issues to consider when investing in BDCs

US fixed income investors love their BDCs (see description). Given what's transpired in global fixed income markets, the overall BDC performance has been spectacular. Here is how BDCs did vs. HY bonds for example.

Source: Ycharts (blue = BDC index, orange = HY bond index)

People love these products because they carry unusually high dividends - often around 10%. Also a good portion of the portfolio assets are floating rate loans (LIBOR + spread), which makes them less vulnerable to rising rates. Furthermore some investors like BDCs because the loans held by these vehicles are often to middle market or even smaller firms, which makes investors feel as if they are circumventing banks. Buy a BDC and "become the bank". These are all great reasons to invest as long as one is aware of the risks. Here are some of them:

1. Keep in mind that BDCs operate a bit like hedge funds and charge similar fees (such as 1.5% management fee and 15% incentive fee).

2. The portfolio loans are indeed to middle market companies, which tend to carry higher rates. But a large portion of these loans is illiquid. That means when markets freeze up, the valuation could be in the hands of some "independent" valuation firm, which will "determine" the NAV.

3. Depending on the BDC, a good portion of your portfolio could be made up of mezzanine loans, which are not only illiquid, but also unsecured and subordinated. In addition, about 10% of many BDCs is in private equity securities.

4. The leverage of the companies that BDCs lend to could be fairly high, sometimes 5-6 times (debt to EBITDA).

5. BDC managers also leverage the whole portfolio, often lending $1.5 for every $1 of capital. Sometimes leverage is obtained using total return swaps, with potential risks of margin calls and forced sales.

6. As capital floods into middle market corporate space and lending becomes highly competitive, BDC managers will reach for yield in order to pay the same dividend. They will lend to increasingly risky credits.

That is why in a real credit crunch, BDC investors should be ready for a wild ride. Here is what BDCs did relative to flow HY bonds in late 2011, after the US debt got downgraded and people were concerned about Italy defaulting.

Source: Ycharts (blue = BDC index, orange = HY bond index)

So by all means, go ahead and invest in BDCs and enjoy the high dividend. Just be aware of what you own.


SoberLook.com
From our sponsor:

Friday, July 12, 2013

HY outflows hit record. Outperformance narrowing

An investment in the S&P500-indexed portfolio right before the financial crisis and held through today would certainly outperform an investment into junk bonds, right? Wrong. The chart below shows the returns of two major HY ETFs (blue and orange) and the largest S&P500 ETF (red). Since the end of 2008, junk bonds have consistently outperformed. As one HY trader pointed out "all of you stock pickers were in the wrong asset class".

Total returns (source: Ycharts; click to enlarge)

But now, with interest rates on the rise and fixed income markets out of favor, that gap has been narrowing. Relative to other fixed income products junk bonds have held up quite well - so far (see post). What worries some HY investors is that junk bond pricing is very dependent on fund flows. Equities are also impacted by money moving in and out of ETFs and mutual funds, but not nearly to the same extent as corporate bonds. And the recent trend in HY bond flows is alarming. The outflows hit an annual record recently.

Source: JPMorgan

It remains to be seen when and if equities ultimately catch up to HY bonds. But if these outflows continue, it won't take long.

SoberLook.com
From our sponsor:

Sunday, July 7, 2013

Junk bonds outperforming other fixed income markets

Here are the latest estimates of performance across the various fixed income markets over the past month.

1-month total return (including interest income)

High yield corporate bonds have been the best performer in this near-panic unwind. The reasons include low default rates and strong corporate balance sheets as well as relatively short maturities and relatively high current income (which is included in the performance numbers above).

A great deal of this outperformance recently though has been driven by the strength of the US equity markets. HY spreads tend to have a strong inverse relationship to stock prices.


And with HY spread being a significant component of the overall yield, strong equity markets have kept yield increases relatively modest. If equities come under pressure however, all bets are off for HY.


SoberLook.com
From our sponsor:

Tuesday, June 11, 2013

Pattern of negative correlation between HY bonds and treasuries has been broken

Since the financial crisis, the correlation between treasuries and many credit assets such as high yield bonds (HY) has been strongly negative. With rates at extraordinarily low levels, HY price movements were driven mostly by spreads. When treasuries rallied it usually meant that something "scary" was going on. During these periods credit spreads would widen (more than rates fell) and HY bonds would sell off. When treasuries sold off, it meant the market perceived some relief to whatever problems we were facing, and HY bonds would rally. These market dynamics created a pattern of negative correlation.

Recent events however broke that pattern. We've had a number of days with both the longer dated treasuries and HY selling off. That means the HY asset class is now responding to rate moves (not just spread). The 3-month correlation between prices of longer dated treasuries and HY bonds is nearing zero. This move toward a "less negative" correlation with treasuries is also visible in other credit assets as well. Sub-investment-grade credit investors are all of a sudden paying much closer attention to rates.


SoberLook.com
From our sponsor:

Sunday, May 12, 2013

Bernanke signals the Fed is uneasy with "reaching for yield"

As Merrill's junk bond index yield crossed the historical low of 5% on Thursday, some senior Fed officials are clearly becoming uneasy. Corporate credit markets are entering bubble territory (see discussion) and up until recently very little has been said on the topic by the US central bank. On Friday Ben Bernanke sent a signal to the markets that the Fed is watching the "reaching for yield" situation "particularly closely".
Ben Bernanke (May 10, 2013) - ... We follow developments in markets for a wide range of assets, including public and private fixed-income instruments, corporate equities, real estate, commodities, and structured credit products, among others. Foreign as well as domestic markets receive close attention, as do global linkages, such as the effects of the ongoing European fiscal and banking problems on U.S. markets.

Not surprisingly, we try to identify unusual patterns in valuations, such as historically high or low ratios of prices to earnings in equity markets. We use a variety of models and methods; for example, we use empirical models of default risk and risk premiums to analyze credit spreads in corporate bond markets. These assessments are complemented by other information, including measures of volumes, liquidity, and market functioning, as well as intelligence gleaned from market participants and outside analysts. In light of the current low interest rate environment, we are watching particularly closely for instances of "reaching for yield" and other forms of excessive risk-taking, which may affect asset prices and their relationships with fundamentals. It is worth emphasizing that looking for historically unusual patterns or relationships in asset prices can be useful even if you believe that asset markets are generally efficient in setting prices. For the purpose of safeguarding financial stability, we are less concerned about whether a given asset price is justified in some average sense than in the possibility of a sharp move. Asset prices that are far from historically normal levels would seem to be more susceptible to such destabilizing moves.
The chart below must give at least some US central bankers a reason to reflect on the current pace of monetary expansion. What "unusual patterns in valuations" will another $1.5 trillion of securities purchases create? The FOMC is likely to have at least some debate on the topic at the next meeting.


SoberLook.com
From our sponsor:

Sunday, November 18, 2012

HY markets hit by outflows; correction likely short-leved

As credit markets sold off last week (see discussion), high yield bond funds saw the largest outflows since this summer (during the market squeeze on Spain). HYG, the HY ETF alone saw a $219 mm worth of shares outflow in a single day.

Click to expand (source: JPMorgan)

This was a much needed adjustment to put some risk back into the market that has been frothy for quite some time now (see discussion from August - of course at the time a number of financial journalists professed that HY was still cheap).

Alex Dumortier of the the Motley Fool had a great chart showing the narrowing of HY vs. S&P500 outperformance. There is clearly a limit to how much the two markets can diverge.

Source: Motley Fool

This correction however will likely be short-lived, given the ramp up of the Fed's balance sheet expansion program. It's not as much about the fundamentals as it is about the supply. The reduction of spread product available in the market via MBS purchases and extraordinarily low rates will provide support to credit markets in general and the higher quality HY paper in particular (in spite of record issuance).


SoberLook.com

Wednesday, November 14, 2012

Credit is finally getting back to reality

After months of frothy conditions, credit valuations are finally beginning to correct. High Yield has traded down materially, as investors have had enough of ridiculous pricing in this market (see discussion).

HYG (HY ETF)

HY CDX traded down to 97.5 after being as high as 101.5 a month ago - a material move even for this market.

Black line & RHS represents HY CDX price

Investment grade spreads widened as well, with IG CDX increasing to 108bp from near 90bp a month ago. Some managers are taking chips off the table before the impending political mess of the US fiscal budget fight. It's finally time to get back to reality.


SoberLook.com

Saturday, November 10, 2012

High yield debt issuance in 2012 hits an all-time record

High yield bond issuance hit an all-time record in 2012, with $306 billion worth of new HY bonds coming to market by the end of October. In fact September was an all-time record month for new issue - on the back of the Fed's latest action.

Source: JPMorgan

Leverage finance space as a whole also hit a new record. Adding  new issue HY bonds and institutional loans (see discussion) puts 2012 ahead of 2007, the previous record.

Source: LCD

Demand for yield remains strong, pushing non-investment grade yields to record lows.

Merrill Lynch HY Bond Index: yield

One of the reasons for this optimism has to do with new issue market pushing out the leveraged finance maturity wall, as companies refinance into longer maturities. Back in 2009 the wall looked quite scary (see this post from 2009), with the largest concentrations of maturities in 2013 and 2014. But the markets have been chipping away at those two years. This reduced the risk of near-term liquidity problems in case the HY new issue market suddenly dries up, lowering expected default rates in the near term.

Source: LCD

We are, however, starting to see some signs of speculative primary market activity. According to JPM, six toggle notes have been issued in October ($2.6bn). These are debt securities that give borrowers the option to skip coupon payments, increasing the face value of the debt instead (payment in kind or PIK). It is roughly the corporate equivalent of option ARM mortgages. Also October saw 11 so-called dividend deals in which the proceeds from a bond sale are used to pay a dividend to the shareholders. This is considered a more risky transaction because rather than using cash to refinance existing debt or acquire a business, the company simply pays it out, causing its leverage to increase. In the mortgage world this is the equivalent of using a home equity loan to take a vacation rather than to put an addition to the house or to repay credit card debt. In spite of some of the more risky transactions, on average the deals have been far less speculative in nature than during the 2006-07 period. This trend of potentially loosening lending standards (such as toggle notes or dividend deals) in the leveraged finance markets will be important to watch going forward.


SoberLook.com

Wednesday, October 31, 2012

Investors continue to demand a LIBOR floor for most new leveraged loans

With investor demand for leveraged loans remaining strong (see discussion), one structural component has not changed. The majority of new leveraged loans still have a LIBOR floor. That means these loans will pay a minimum coupon plus spread, no matter what LIBOR does. In fact according to LCD, the average floor of 1.25% in October has changed little this year for new-issue loans in spite of investor demand for the product.  That is investors want these loans but they will typically only buy loans that have the LIBOR floor included. A loan with a spread of 3% and a floor of 1.25% will pay 4.25% (act/360) annually, even though the 3m LIBOR is only 0.32%. The chart below shows the percentage of new issue loans with a LIBOR floor and the average floor level for each month.

Source: LCD

Those who think in terms of options will recognize that the borrower (in addition to paying the usual LIBOR + spread) has written the investor/lender a series of in-the-money put options on LIBOR (an in-the-money LIBOR floor). Even the options with longer maturities are in-the-money because the forward LIBOR curve is below the average floor level all the way out to 2016 (option strike level is above the forward underlying). And most of these loans do not go too far beyond that point. Even if the maturity is out to five years, most loans will amortize/prepay to a shorter average maturity (at least based on history).

Source: LCD

The rationale for maintaining a LIBOR floor on new deals is simple. Given the Fed's efforts to maintain near zero rates for a prolonged period of time, the probability of LIBOR rising substantially is low. In order for this product to compete with high yield bonds, which are fixed rate instruments, it needs to guarantee some minimum coupon in spite of what the Fed is doing. To be sure, investors holding these loans will receive a smaller coupon on average than with high yield bonds, but the floor makes that difference less of an issue.

What attracts some investors to leveraged loans is that they receive a minimum coupon because of the floor but to some extent they also get an inflation hedge. Should inflation surprise to the upside, LIBOR may in fact rise above the floor level, increasing the coupon. HY bonds on the other hand will continue paying a fixed coupon.


SoberLook.com

Friday, September 14, 2012

Investors fight over "B+" bonds at 5.75%

As an example of how frothy fixed income markets have become, Reynolds did a $3.25 billion HY issuance today. They repaid a great deal of existing debt, but also took half a billion of cash for general purposes - in effect increasing leverage.
Reuters: - Reynolds Group Issuer Inc/LLC/(Lux) S.A. on Friday sold $3.25 billion of senior secured notes in the 144a private placement market, said IFR, a Thomson Reuters service. The size of the deal was increased from an originally planned $1 billion.
And here is the kicker. This is a B1/B+ rated firm ("middle of the road" junk) that just increased leverage. The yield on these 8-year bonds is 5.75%. The bonds are "secured" by some of the Reynolds assets - so if they fail to pay, the lenders can wrap themselves in all the foil they want. The deal was supposedly highly oversubscribed as institutions clamor for yield. Some investors got no or very little allocation of this "hot" issue.

This is not entirely surprising, given the overall HY market yields hitting new record lows. HY is not really "high yield" any longer. This is not going to end well.

JPM Domestic HY Index yield (YTW; Bloomberg)


SoberLook.com

Tuesday, August 7, 2012

The US HY bond market looks overheated

The rally in leveraged finance markets is back on, as investors snap up junk bonds as quickly as they come to market.
LCD: - Price guidance for Iron Mountain’s [records-storage company] 12-year (non-call five) subordinated notes is 5.75-6%, and pricing is expected this afternoon via Morgan Stanley, J.P. Morgan, Bank of America, HSBC, RBS, Scotia, and Barclays, according to sources. The deal has been upsized by $50 million, to $1 billion.
This firm is raising $1 billion of 12-year subordinated (B+/B1) money at under 6%. The firm is rated BB- and is on negative rating outlook. And there is no shortage of buyers for such bonds.

As another indication of an overheated market, shares outstanding of BlackRock's iShares iBoxx $ High Yield Corporate Bond Fund ETF (HYG) hit another record ($16 billion of AUM) as retail inflows accelerate.

HYG shares outstanding  (source: Bloomberg)

HY mutual fund flows have been strong this year as well. The year-to-date net investment in HY mutual funds far exceeds all of last year's inflows and is on target to hit an all-time record by year-end.

Source: JPMorgan

That has driven HY bond yields down to their historical support level.

JPMorgan US HY Index yield (YTW)  (source: Bloomberg)

Such aggressive valuations and tremendous retail participation make this market a prime candidate for a correction. This demand is particularly surprising given the macro backdrop of slowing global demand (with renewed weakness in manufacturing - see below) and unresolved issues in the Eurozone.

JPM Global Manufacturing PMI (source: Markit)


SoberLook.com

Saturday, July 21, 2012

Lack of product, cash on the sidelines, and low rates, all driving HY valuations to new highs

What's creating the frothy market that allows companies that normally would turn to VC funding to use HY debt markets instead? The answer turns out to be lack of product, rising cash on the sidelines, and low rates combined with demand for income.

As discussed earlier, based on JPMorgan's analysis there is simply not enough net new issuance to meet the demand. The chart below shows that year-to-date high yield and institutional leveraged loan issuance has been below last year's volume.

Source: LCD

And cash allocated to the HY asset class is accumulating - in search for new product.
Source: Credit Suisse
CS: - After a quiet few months of issuance combined with additional retail demand, we believe the proverbial cash-on-the sidelines is sitting at one-year highs and creates a very positive tailwind in the HY asset class buffering it from a negative macro backdrop.
In another sign of strong demand, shares outstanding of BlackRock's iShares iBoxx $ High Yield Corporate Bond Fund ETF (HYG) resumed their climb, hitting another record. HYG assets are now close to $15bn as retail cash pours in.

HYG shares outstanding

Extraordinarily low interest rates and the need for income are also contributing to this demand.
JPMorgan: - With the recent drop in high-yield bond [yields] (7.28%) and loan yields (6.55%) to fresh 2-month lows and high-grade bond yields also falling further this week to record lows (3.67%), the performance of credit highlights investors’ affinity for income and stability as a highly uncertain global economic landscape continues to develop.
These factors are driving the HY bond valuations to new highs, allowing companies to obtain ridiculously cheap financing. And corporations are jumping in to grab this funding while the going is good.

JPMorgan HY Total Return Index


SoberLook.com

Thursday, July 19, 2012

In a sign of a frothy market 5-Hour Energy borrows $450 million

New company? One product? Can't raise equity? That's OK. Just hit the high yield bond market which is red hot. The market will lend you the money. And you will even get more than you originally planned.
Reuters: - Innovation Ventures LLC/Finance Corp (5-Hour Energy) on Thursday sold $450 million of senior secured notes in the 144a private placement market, said IFR. The deal was upsized from an originally planned $400 millon. Bank of America Merrill Lynch and Jefferies were the joint bookrunning managers for the sale.

Obviously the folks on Wall Street have been consuming too much 5-hour energy to lend money to a firm that should really be trying to raise venture capital equity. This is truly an indication of a frothy fixed income market.


SoberLook.com

Saturday, June 23, 2012

High Yield bond market exceeds $1.3 trillion - and still not enough

Year to date we've had $157.5 billion of new HY bond issuance. Plus $2.1bn of investment grade bonds got downgraded to non-investment grade. That's $163.1bn of new supply in the market, pushing the overall market size to $1.32 trillion - a new record.


But it turns out that's not enough to satisfy the demand. That's because a number of HY bonds have been taken out of the market (calls, tenders, maturities). We've also had some bonds (like Ford) that are getting moved out of HY into investment grade due to upgrades ("rising stars"). In addition a large part of the HY coupon gets plowed back into HY markets while mutual fund flows continue to stay positive.

HY demand

That means that year-to-date we have about $19bn more in demand than in new supply. Corporate America continues to have access to cheap credit. But uneasy about increasing leverage and with limited investment opportunities companies are not issuing enough paper to satisfy the enormous appetite for fixed income product.


SoberLook.com

Friday, May 18, 2012

Latest HY market statistics

As discussed earlier, the high yield market is growing in spite of the uncertainties around global growth. The charts below provide the latest statistics on the market.

Institutional leveraged loans issuance continues to exceed HY bond issuance as demand for product from CLOs stays strong.

Source: Fitch (click to enlarge)

The use of proceeds is dominated by refinancing activities, capex, and other corporate expenses. M&A and LBO activity is still subdued.

Source: Fitch (click to enlarge)

The overall market is now around $1.1 trillion dollars.

Source: Fitch (click to enlarge)

A pause in growth should be expected as the Eurozone mess flares up. With rates at historical lows however, demand will continue to stay strong. New issuance will likely clear the market at somewhat more reasonable spreads than the frothy transactions we've had recently.


SoberLook.com
Related Posts Plugin for WordPress, Blogger...
Bookmark this post:
Share on StockTwits
Scoop.it