Tuesday, April 3, 2012

Restructuring the Irish promissory notes

In 2010 the Irish government bailed out (recapitalized) the Irish banks with 30bn euros. The government could not easily raise these funds in the market so it used promissory notes (PNs) instead of cash (sort of what California did when they paid salaries with IOUs during their "budget issues" in 09). These PNs are set up to pay a set amount over the next 20 years.

The promissory notes were used as collateral with the Central Bank of Ireland to obtain central bank emergency financing called ELA. That collateral did not qualify for LTRO, leaving ELA balances outstanding. Since then the banks were "restructured" creating the Irish Bank Resolution Corporation (IBRC) - the "bad bank" to hold all the wonderful real estate loans and properties. Now IBRC owes the Central Bank of Ireland money under the ELA.

This year about EUR 3.1bn of PNs was due (on March 31st), but the Irish government was in no position to pay that in cash. Instead the goal has been to kick the can down the road - as far as it can roll. The Finance Minister Michael Noonan has been trying for a while to restructure the PNs by swapping them into long-term government bonds. His negotiations with the EU/ECB have yielded only a partial result. He was able to roll just the 3.1bn due this year, but it required a fairly messy transaction. The issue is that the ELA financing is meant to be a temporary measure and the ECB wants it paid down asap.

Here are the steps for the restructuring of the PN - just the EUR 3.1bn (this time around - no guarantee this will work next time):

1. The Government issues a long-term bond that it delivers to IBRC in return for IBRC extinguishing the 3.1bn worth of PNs (it effectively pays its "promise" with long term bonds instead of cash).

2. IBRC places the bond as collateral with the Bank of Ireland (not to be confused with the Central Bank of Ireland) to borrow cash for a year. Given that the Bank of Ireland is controlled by the government, it can roll this loan indefinitely.

3. IBRC uses the cash from the loan to pay down the ELA financing and get back the PN it had out with the Central Bank of Ireland.

4. The Bank of Ireland then uses these long-term bonds as collateral to borrow from the Central Bank of Ireland/Eurosystem under the MRO or 3m LTRO programs.


Restructuring of Irish promissory notes

With this transaction, the Irish government doesn't have to use cash to pay the promissory notes, the Bank of Ireland makes a spread between where it borrows from the central bank and what it receives from IBRC, and the ECB makes sure that the ELA is paid down. Everyone is happy, right? Not exactly. This is a difficult transaction and Michael Noonan would much rather have used financing from EFSF directly. Most importantly, this is only a portion of the PN restructuring and this issue will be back shortly when the next portion of the PN is due. In 2014 the PNs due will constitute some 15% of projected cash needs of the Irish government.

SoberLook.com

Monday, April 2, 2012

When looking for assets vulnerable to the next crisis, don't fight the last war

Here is an interesting chart from the Fed. It shows bank (all US chartered banks) charge-off rates for 3 different asset classes: commercial/industrial (corporate) loans, commercial real estate loans, and residential real estate loans. Charge-offs for all three spiked during the last recession. But the previous two recessions were quite different.

The "Gulf War-I" recession caused an increase in corporate and commercial real estate loans charge-offs, while residential loans remained relatively intact. The "Dot-com bust" recession however only hit the corporate loan asset class (Worldcom, Enron, Mirant, etc.). Real estate loans charge-offs remained immaterial.


What's interesting is that on a relative basis the largest dollar losses during this past recession came from residential loans followed by commercial property loans, with corporate loans producing the least amount of dollar losses. There isn't a sufficient data for a conclusive result, but one could postulate that risk appetite (looser lending standards) and ratings biases were driven by how assets behaved in earlier recessions. And the better the asset class performed in previous economic shocks, the more comfortable the lenders/investors became with the product. Risk managers and regulators in effect "fight the last war".

As an example of that effect consider the fact that sovereign debt did quite well during 08-09 and became the darling of European banks. Clearly these banks held sovereign debt before the 08 crisis, but the holdings increased considerably during 2009 and 2010. Just as with mortgage loans prior to the crisis (using securitization), both the regulators and the rating agencies made holding sovereign debt easy for banks.

The problem markets/asset classes for the next crisis may therefore be those that did well during the recent economic shocks. There are a few that come to mind, but that's a topic for another discussion.


SoberLook.com

Copper underperforming US equities may signal EMG slowdown expectations

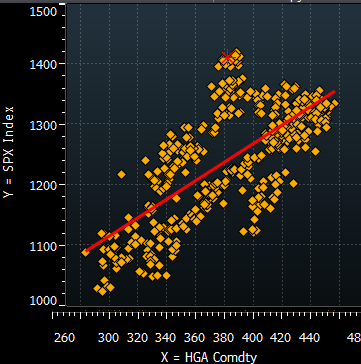
A quick look at the two-year scatter plot of the SP500 index and copper futures (HGA) prices shows a possible dislocation. Is the equity market overpriced relative to copper?

SP500 vs. HGA (copper)

Recent data shows copper outperforming equities in 2010 (unfortunately HGA data doesn't exist for an earlier period), as QE2 driven cyclical assets were bid up on emerging markets/China growth story. Since the spike in the Eurozone crisis, copper underperformed into this year. One explanation for this divergence is the lowered set of expectations for emerging markets (EMG) growth. With China, Brazil, and particularly India growth expected to moderate (or possibly worse), copper continues to lag.

SP500 vs. HGA (copper)

The effect is quite pronounced today as the perceived positive news from China lifted copper futures relative to SP500. Year-to-date however copper still lags the SP500 by some 10%. Going forward copper's performance relative to the US equity market provide a good indicator of EMG growth expectations.

SP500 (white) vs. HGA (yellow) intraday


Note: if anyone is interested in doing a longer-term comparison using LME forwards instead of HGA, please email us.

SoberLook.com

Eurozone unemployment highest since creation of the euro, but the data looks suspect

The European Commission's Eurostat published the EU and the Eurozone unemployment numbers today. According to Eurostat the Eurozone unemployment is now at 10.8%, a level not seen since 1997. The last time the unemployment rate was this high, the euro did not yet exist. This helps explain the double-dip consumer recession already in place.

EU and Eurozone unemployment (source: Eurostat)

One of the scarier components of the latest result is the spike in EU's and Eurozone's youth unemployment. Both are above 21% and trending higher.

EU and Eurozone youth (ages 15-24) unemployment (source: Eurostat)

There is one unsettling point about the Eurostat unemployment data however. If you zoom in on the Eurozone unemployment rate most recent data, the chart is actually a straight line. A straight line in any monthly data is a suspect. But in a seasonally adjusted unemployment measure for the whole of Eurozone that increases by exactly 10bp for 8 months in a row just looks "smoothed".  People suspect China of cooking economic numbers, but the European Commission? If anyone has an explanation, send/post your comment.

Eurostat's unemployment rate in the Eurozone- recent data (Bloomberg)


SoberLook.com

Sunday, April 1, 2012

Why high gas prices at the pump? The answer is BICS

Here is a simple question: where is the growth in crude oil consumption coming from? According to Barclays Capital it's driven by four nations. They are Brazil, India, China, and somewhat surprisingly (and yes, we are talking about demand growth) Saudi Arabia, the so called BICS nations.
Barclays Capital: The reason for bringing together Brazil, India, China and Saudi Arabia is that once one has disaggregated global oil demand into BICS and non-BICS, it becomes clear which element is the key to predicting global oil demand. If you get BICS right, you have normally got the shape of the whole picture right. By contrast, if you get the US, EU or OECD right, you quite often can still miss the big picture. Perhaps the focus should be shifting to getting a better handle on BICS.
Last year BICS generated all the growth in global demand for oil. Given the economic malaise in the developed world, this year we expect the same. So the next time someone asks why people in the US and the EU pay such high gasoline prices all of a sudden, the answer is simple - BICS.

Demand growth in mb/day (Source: Barclays Research)
SoberLook.com

Eurozone money market funds, a melting ice cube

The ECB's LTRO program accomplished much in terms of reducing liquidity risk in the Eurozone's financial sector. But as is often the case with government interventions, it created numerous "unintended consequences". One of those effects is a massive reduction in the availability of short-term non-government paper. This paper has been taken out of the market for two reasons:

1. With attractive term financing from the ECB, there is far less need to issue euro denominated commercial paper or short-term notes.

2. A great deal of short-term paper that has been issued is trapped at the ECB (more precisely the NCBs) as collateral and is not coming out any time soon.

This is creating difficulties for euro denominated money market funds. As an example, below is a chart for the JPMorgan Luxembourg formed euro money market fund (ticker symbol JPMELRF LX). It has become difficult for the firm to retain investors because the return on this fund has literally flat-lined.

 JPMELRF LX total return (Bloomberg)
Description: JPMorgan Funds Euro Market Fund is an open-end SICAV incorporated in Luxembourg. The Fund's objective is to achieve a competitive total return. The Fund invests all of its assets, excluding cash and deposits, in high transferable debt securities and/or bonds of which at least 75% will be denominated in Euro.
Needless to say JPMorgan is not happy about that.
Reuters: "The LTROs are a double-edged sword," said John Donohue, chief investment officer for J.P. Morgan Asset Management Global Liquidity. "They calmed everybody down and took the liquidity tail risk off the table for money funds. But there is less supply now for us to get invested."

Ultimately this may mean banks, companies, and governments will need less short-term funding, a so-called crowding out effect. That could result in fewer investment opportunities for money market funds, which generally prefer taxable investments thanks to their higher yields.
Near zero (or sometimes zero) rates combined with the uncertainties around the money market product are sending Eurozone investors out of the product. The total euro denominated money market balances have declined sharply in recent months.

Total Eurosystem money market funds holdings (EUR MM, Source: the ECB)

It is unclear if there is a future for this product in the Eurozone. It may take the unwind of the LTRO program some three years down the road and the normalization of short-term issuance before the business becomes profitable again. For now some firms will run it purely as a loss leader for their asset management clients with hopes of recouping revenues elsewhere.


SoberLook.com

Bundesbank tries to cap periphery exposure as TARGET2 claims spike

As predicted a month ago, the Bundesbank balance sheet grew materially due to increases in TARGET2 claims against other central banks. Again, these imbalances are driven by LTRO financing provided to periphery banks. In an LTRO transaction the periphery National Central Banks (NCBs) credit the accounts of their nation's banks (who seek LTRO financing) and debit the Eurosystem account. The periphery banks then pay down secured loans from German banks (replacing them with LTRO), increasing Bundesbank's TARGET2 claims (as euros move from periphery to Germany). In effect Bundesbank partially finances the periphery NCBs via the ECB. Below is the latest snapshot of Bundesbank's balance sheet.

Deutsche Bundesbank
Explanations: * The balance sheet items for gold, foreign currency, securities, and financial instruments are revalued at market rates at the end of each quarter. The figures for the latest date are always to be regarded as provisional. Subsequent revisions, which appear in the following publication, are therefore not specially marked. Discrepancies in the totals are due to rounding. — 1 For the detailed composition of the Bundesbank’s currency reserves, see table "Official reserve assets and other foreign currency assets" (Statistics/Regularly up-dated economic data/Data Template on International Reserve/Foreign Currency Liquidity), which is updated on a weekly basis. — 2 Deutsche Bundesbank’s claims on and liabilities to non-Eurosystem central banks are not included, see also footnote 4. — 3 Excluding Deutsche Bundesbank’s claims on and liabilities to central banks of the Eurosystem, see also footnote 4. — 4 Deutsche Bundesbank’s claims on and liabilities to central banks of the European Union (i.e. central banks of the Eurosystem and non-Eurosystem central banks) are recorded on a net basis; the net position of the Deutsche Bundesbank vis-à-vis central banks of the European Union is included within the item "Other assets" ("Other liabilities") if it has a positive (negative) sign. — 5 According to the accounting regime chosen by the Eurosystem on the issue of euro banknotes, a share of 8% of the total value of the euro banknotes in circulation is allocated to the ECB on a monthly basis. The counterpart of this adjustment is disclosed as an "Intra-Eurosystem liability related to banknote issue". The remaining 92% of the value of the euro banknotes in circulation are allocated to the NCBs on a monthly basis too, whereby each NCB shows in its balance sheet a share of the euro banknotes issued corresponding to its paid-up share in the ECB’s capital. The difference between the value of the euro banknotes allocated to the NCB according to the aforementioned accounting regime, and the value of euro banknotes put into circulation, is also disclosed as an "Intra-Eurosystem claim/ liability related to banknote issue".
Note that in order to obtain the exact TARGET2 position of the Bundesbank, one needs to net the "other assets" with "other liabilities". There is also a relatively small amount of claims against EU central banks that are not part of the Eurosystem that should be taken out. For the purposes of tracking the general trend however, that component can be ignored.

Deutsche Bundesbank claims on NCBs


This would not be an issue if the Eurosystem is to stay intact. However should a nation exit the euro, its central bank may not have the ability to cover its TARGET2 liabilities. In that case the ECB and the member states would be responsible for parsing out the losses among the remaining states based on their share.

Clearly Bundesbank has become concerned about its exposure to periphery nations. The central bank reacted to this increase by limiting the types of collateral it accepts. In particular it will no longer accept bonds guaranteed by certain Eurozone states (several states bailed out their banks by guaranteeing bonds issued by these banks, allowing them to post such bonds as collateral for LTRO financing - see this post for more detail)
Bloomberg (ht Kostas Kalevras): The Bundesbank won’t lend to banks against bank debt guaranteed by Greece, Ireland and Portugal from May, the newspaper said, citing unidentified officials. The Frankfurt- based central bank currently has less than 500 million euros ($667 million) of those bonds on its balance sheet, FAZ reported.
These specific bonds constitute a relatively minor exposure for the central bank, but because of the massive claims against the NCBs, it is trying to cap the overall exposure. This highlights Bundesbank's concern about the stability of the Eurosystem in its current form. It is possible this concern will soon spread to other core central banks, creating further rifts within the Eurosystem.


SoberLook.com

Everything you always wanted to know about credit derivatives but were afraid to ask

Morgan Stanley did an excellent job with their latest credit derivatives tutorial.

Enjoy!

Credit Derivatives -
SoberLook.com
Related Posts Plugin for WordPress, Blogger...
Bookmark this post:
Share on StockTwits
Scoop.it